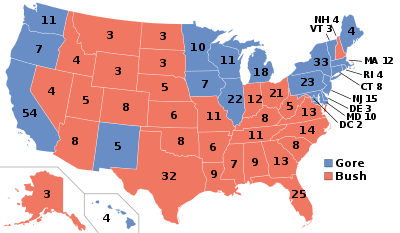
The 2000 United States presidential election in Oklahoma took place on November 7, 2000, and was part of the 2000 United States presidential election. Voters chose 8 representatives, or electors to the Electoral College, who voted for president and vice president.
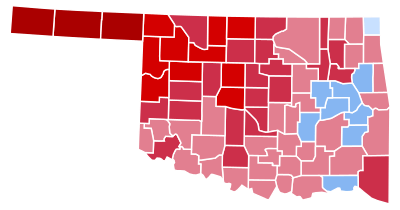
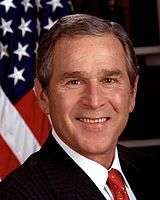
Oklahoma was won by the Republican Party candidate, Texas Governor George W. Bush with a 21.88% margin of victory. Despite Vice President Al Gore's loss in the state, he is the most recent Democrat to win any of its counties in a presidential election, namely Ottawa, Cherokee, Muskogee, Okmulgee, McIntosh, Hughes, Haskell, Latimer, and Choctaw. This was the last election until 2016 that any third-party candidates were granted ballot access in Oklahoma.
Electors
The electors of each state and the District of Columbia met on December 18, 2000[1] to cast their votes for president and vice president. The Electoral College itself never meets as one body. Instead the electors from each state and the District of Columbia met in their respective capitols.
The following were the members of the Electoral College from the state. All were pledged to and voted for George Bush and Dick Cheney:[2]
- Steve Byas
- James Cruson
- Paul Hollrah
- Kristal Markowitz
- Bob McDowell
- Donald O'Nesky
- Tom Prince
- George W. Wiland
Results
By county
| County |
Gore% |
Gore# |
Bush% |
Bush# |
Others% |
Others# |
Total |
| Adair County | 39.50% | 2,361 | 58.61% | 3,503 | 1.89% | 113 | 5,977 |
| Alfalfa County | 23.25% | 583 | 75.23% | 1,886 | 1.52% | 38 | 2,507 |
| Atoka County | 44.08% | 1,906 | 54.93% | 2,375 | .99% | 43 | 4,324 |
| Beaver County | 13.80% | 339 | 85.18% | 2,092 | 1.02% | 25 | 2,456 |
| Beckham County | 36.86% | 2,408 | 62.26% | 4,067 | .87% | 57 | 6,532 |
| Blaine County | 34.25% | 1,402 | 64.31% | 2,633 | 1.44% | 59 | 4,094 |
| Bryan County | 47.28% | 5,554 | 51.80% | 6,084 | .92% | 108 | 11,746 |
| Caddo County | 46.38% | 4,272 | 52.50% | 4,835 | 1.12% | 103 | 9,210 |
| Canadian County | 26.68% | 8,367 | 72.32% | 22,679 | 1.% | 314 | 31,360 |
| Carter County | 40.46% | 6,659 | 58.74% | 9,667 | .8% | 132 | 16,458 |
| Cherokee County | 50.15% | 7,256 | 47.82% | 6,918 | 2.03% | 294 | 14,468 |
| Choctaw County | 52.66% | 2,799 | 46.30% | 2,461 | 1.03% | 55 | 5,315 |
| Cimarron County | 15.30% | 227 | 82.88% | 1,230 | 1.82% | 27 | 1,484 |
| Cleveland County | 36.49% | 27,792 | 62.22% | 47,393 | 1.29% | 986 | 76,171 |
| Coal County | 48.60% | 1,148 | 50.64% | 1,196 | .76% | 18 | 2,362 |
| Comanche County | 40.81% | 11,971 | 58.31% | 17,103 | .88% | 259 | 29,333 |
| Cotton County | 43.03% | 1,068 | 55.92% | 1,388 | 1.05% | 26 | 2,482 |
| Craig County | 46.83% | 2,568 | 51.33% | 2,815 | 1.84% | 101 | 5,484 |
| Creek County | 41.08% | 9,753 | 57.20% | 13,580 | 1.72% | 408 | 23,741 |
| Custer County | 31.97% | 3,115 | 66.99% | 6,527 | 1.04% | 101 | 9,743 |
| Delaware County | 41.29% | 5,514 | 57.05% | 7,618 | 1.66% | 221 | 13,353 |
| Dewey County | 26.98% | 599 | 72.39% | 1,607 | .63% | 14 | 2,220 |
| Ellis County | 23.25% | 468 | 75.16% | 1,513 | 1.59% | 32 | 2,013 |
| Garfield County | 30.18% | 6,543 | 68.73% | 14,902 | 1.1% | 238 | 21,683 |
| Garvin County | 42.56% | 4,189 | 56.24% | 5,536 | 1.2% | 118 | 9,843 |
| Grady County | 37.09% | 6,037 | 61.69% | 10,040 | 1.22% | 199 | 16,276 |
| Grant County | 28.33% | 709 | 70.40% | 1,762 | 1.28% | 32 | 2,503 |
| Greer County | 38.99% | 839 | 59.80% | 1,287 | 1.21% | 26 | 2,152 |
| Harmon County | 42.07% | 507 | 57.43% | 692 | .5% | 6 | 1,205 |
| Harper County | 22.22% | 374 | 77.01% | 1,296 | .77% | 13 | 1,683 |
| Haskell County | 54.24% | 2,510 | 44.06% | 2,039 | 1.71% | 79 | 4,628 |
| Hughes County | 50.91% | 2,334 | 47.90% | 2,196 | 1.2% | 55 | 4,585 |
| Jackson County | 30.82% | 2,515 | 68.53% | 5,591 | .65% | 53 | 8,159 |
| Jefferson County | 48.01% | 1,245 | 50.91% | 1,320 | 1.08% | 28 | 2,593 |
| Johnston County | 46.03% | 1,809 | 52.72% | 2,072 | 1.25% | 49 | 3,930 |
| Kay County | 33.71% | 6,122 | 64.79% | 11,768 | 1.5% | 272 | 18,162 |
| Kingfisher County | 21.53% | 1,304 | 77.49% | 4,693 | .97% | 59 | 6,056 |
| Kiowa County | 41.17% | 1,544 | 57.95% | 2,173 | .88% | 33 | 3,750 |
| Latimer County | 50.83% | 1,865 | 47.40% | 1,739 | 1.77% | 65 | 3,669 |
| Le Flore County | 43.62% | 6,536 | 54.82% | 8,215 | 1.56% | 234 | 14,985 |
| Lincoln County | 35.38% | 4,140 | 63.13% | 7,387 | 1.49% | 174 | 11,701 |
| Logan County | 35.04% | 4,510 | 63.61% | 8,187 | 1.34% | 173 | 12,870 |
| Love County | 45.37% | 1,530 | 53.59% | 1,807 | 1.04% | 35 | 3,372 |
| McClain County | 34.91% | 3,679 | 64.05% | 6,750 | 1.04% | 110 | 10,539 |
| McCurtain County | 35.79% | 3,752 | 62.97% | 6,601 | 1.23% | 129 | 10,482 |
| McIntosh County | 54.05% | 4,206 | 44.26% | 3,444 | 1.68% | 131 | 7,781 |
| Major County | 18.94% | 635 | 79.71% | 2,672 | 1.34% | 45 | 3,352 |
| Marshall County | 45.10% | 2,210 | 53.90% | 2,641 | 1.% | 49 | 4,900 |
| Mayes County | 47.27% | 6,618 | 50.94% | 7,132 | 1.79% | 251 | 14,001 |
| Murray County | 45.98% | 2,263 | 53.01% | 2,609 | 1.02% | 50 | 4,922 |
| Muskogee County | 50.70% | 12,520 | 47.87% | 11,820 | 1.43% | 353 | 24,693 |
| Noble County | 30.15% | 1,416 | 68.77% | 3,230 | 1.09% | 51 | 4,697 |
| Nowata County | 44.25% | 1,703 | 53.75% | 2,069 | 2.% | 77 | 3,849 |
| Okfuskee County | 47.89% | 1,814 | 50.42% | 1,910 | 1.69% | 64 | 3,788 |
| Oklahoma County | 36.57% | 81,590 | 62.34% | 139,078 | 1.09% | 2,443 | 223,111 |
| Okmulgee County | 54.53% | 7,186 | 43.99% | 5,797 | 1.48% | 195 | 13,178 |
| Osage County | 47.39% | 7,540 | 51.15% | 8,138 | 1.45% | 231 | 15,909 |
| Ottawa County | 49.49% | 5,647 | 49.29% | 5,625 | 1.22% | 139 | 11,411 |
| Pawnee County | 41.10% | 2,435 | 57.15% | 3,386 | 1.76% | 104 | 5,925 |
| Payne County | 37.36% | 9,319 | 61.15% | 15,256 | 1.49% | 372 | 24,947 |
| Pittsburg County | 46.63% | 7,627 | 52.05% | 8,514 | 1.32% | 216 | 16,357 |
| Pontotoc County | 41.97% | 5,387 | 56.86% | 7,299 | 1.17% | 150 | 12,836 |
| Pottawatomie County | 39.27% | 8,763 | 59.31% | 13,235 | 1.42% | 318 | 22,316 |
| Pushmataha County | 45.29% | 1,969 | 53.61% | 2,331 | 1.1% | 48 | 4,348 |
| Roger Mills County | 26.14% | 441 | 73.15% | 1,234 | .71% | 12 | 1,687 |
| Rogers County | 37.35% | 10,813 | 61.18% | 17,713 | 1.47% | 425 | 28,951 |
| Seminole County | 48.09% | 3,783 | 50.99% | 4,011 | .92% | 72 | 7,866 |
| Sequoyah County | 44.27% | 5,425 | 53.97% | 6,614 | 1.75% | 215 | 12,254 |
| Stephens County | 36.98% | 6,467 | 62.10% | 10,860 | .92% | 161 | 17,488 |
| Texas County | 17.81% | 1,084 | 81.54% | 4,964 | .66% | 40 | 6,088 |
| Tillman County | 41.80% | 1,400 | 57.33% | 1,920 | .87% | 29 | 3,349 |
| Tulsa County | 37.34% | 81,656 | 61.34% | 134,152 | 1.32% | 2,883 | 218,691 |
| Wagoner County | 38.31% | 8,244 | 60.33% | 12,981 | 1.36% | 292 | 21,517 |
| Washington County | 32.03% | 6,644 | 66.47% | 13,788 | 1.5% | 312 | 20,744 |
| Washita County | 35.00% | 1,564 | 63.79% | 2,850 | 1.21% | 54 | 4,468 |
| Woods County | 34.83% | 1,235 | 64.13% | 2,274 | 1.04% | 37 | 3,546 |
| Woodward County | 27.46% | 1,950 | 71.37% | 5,067 | 1.17% | 83 | 7,100 |
See also
|
|---|
| Candidates | | |
|---|
General
articles | |
|---|
Local
results | |
|---|
Other 2000
elections | |
|---|