United States presidential election in Pennsylvania, 2000
|
| ||||||||||||||||||||||||||
| ||||||||||||||||||||||||||
| ||||||||||||||||||||||||||
 County Results
| ||||||||||||||||||||||||||
| ||||||||||||||||||||||||||


The 2000 United States presidential election in Pennsylvania took place on November 7, 2000, and was part of the 2000 United States presidential election. Voters chose 23 representatives, or electors to the Electoral College, who voted for president and vice president.
Pennsylvania was won by Vice President Al Gore by a 4.17% margin of victory. However, voter enthusiasm for both candidates was generally low throughout the campaign. Gore failed to capture Clinton's appeal in strongly Democratic regions such as Pittsburgh and Scranton, and thus carried these areas by a smaller number than his predecessor. However, opposition to Bush was particularly strong in the suburban counties of Philadelphia; although these areas at the time were typically Republican leaning, they featured a strong culturally liberal bent, and thus Bush was unable to appeal to voters. Bush support was particularly strong in rural, central Pennsylvania, where the Texas Governor appealed to Evangelical voters and where Gore's connection to gun control policies was strongly rejected. Marginal wins in both of the state's metropolitan areas helped the Vice President to capture the state.[1] This was the first election since 1968 that the candidate who won Pennsylvania did not win the general election, and only the fourth time that has happened since 1916. As of the 2016 presidential election, this is the last election in which Greene County, Mercer County, and Lawrence County voted for the Democratic candidate.
Electors
The electors of each state and the District of Columbia met on December 18, 2000[2] to cast their votes for president and vice president. The Electoral College itself never meets as one body. Instead the electors from each state and the District of Columbia met in their respective capitols.
The following were the members of the Electoral College from the state. All were pledged to and voted for Al Gore and Joe Lieberman:[3]
- Kathy Black
- Richard W. Bloomingdale
- Robert P. Casey Jr.
- Nelson Diaz
- William M. George
- Ken Jarin
- James J. Johnston
- Edward Keller
- Robert Mellow
- Thomas J. Murphy, Jr.
- Elsa Favila
- Robert O'Connor
- Lazar M. Palnick
- Stephen R. Reed
- T. J. Rooney
- Joyce Savocchio
- John F. Street
- Patsy J. Tallarico
- Christine M. Tartaglione
- Margaret M. Tartaglione
- Marian Tasco
- Sala Udin
- Anna Verna
Results
| United States presidential election in Pennsylvania, 2000[4] | |||||
|---|---|---|---|---|---|
| Party | Candidate | Votes | Percentage | Electoral votes | |
| Democratic | Al Gore | 2,485,967 | 50.60% | 23 | |
| Republican | George W. Bush | 2,281,127 | 46.43% | 0 | |
| Green | Ralph Nader | 103,392 | 2.10% | 0 | |
| Reform | Pat Buchanan | 16,023 | 0.33% | 0 | |
| Constitution | Howard Phillips | 14,428 | 0.29% | 0 | |
| Libertarian | Harry Browne | 11,248 | 0.23% | 0 | |
| Write-ins | - | 934 | 0.02% | 0 | |
| Totals | 4,913,119 | 100.00% | 23 | ||
| Voter turnout (Voting age/Registered) | 53%/63% | ||||
By county
| County | Gore% | Gore# | Bush% | Bush# | Others% | Others# | Total |
|---|---|---|---|---|---|---|---|
| Adams County | 34.94% | 11,682 | 62.36% | 20,848 | 2.70% | 903 | 33,433 |
| Allegheny County | 56.65% | 329,963 | 40.41% | 235,361 | 2.95% | 17,154 | 582,478 |
| Armstrong County | 40.58% | 11,127 | 56.55% | 15,508 | 2.87% | 788 | 27,423 |
| Beaver County | 52.89% | 38,925 | 44.15% | 32,491 | 2.96% | 2,177 | 73,593 |
| Bedford County | 28.17% | 5,474 | 69.97% | 13,598 | 1.87% | 363 | 19,435 |
| Berks County | 43.76% | 59,150 | 52.73% | 71,273 | 3.51% | 4,740 | 135,163 |
| Blair County | 34.94% | 15,774 | 62.86% | 28,376 | 2.19% | 990 | 45,140 |
| Bradford County | 33.91% | 7,911 | 62.84% | 14,660 | 3.25% | 759 | 23,330 |
| Bucks County | 50.46% | 132,914 | 46.29% | 121,927 | 3.26% | 8,581 | 263,422 |
| Butler County | 35.35% | 25,037 | 62.14% | 44,009 | 2.51% | 1,778 | 70,824 |
| Cambria County | 50.27% | 30,308 | 46.45% | 28,001 | 3.28% | 1,977 | 60,286 |
| Cameron County | 34.68% | 779 | 61.58% | 1,383 | 3.74% | 84 | 2,246 |
| Carbon County | 50.14% | 10,668 | 45.67% | 9,717 | 4.19% | 892 | 21,277 |
| Centre County | 43.22% | 21,409 | 52.83% | 26,172 | 3.95% | 1,957 | 49,538 |
| Chester County | 43.74% | 82,047 | 53.36% | 100,080 | 2.90% | 5,435 | 187,562 |
| Clarion County | 35.38% | 5,605 | 61.83% | 9,796 | 2.79% | 442 | 15,843 |
| Clearfield County | 38.28% | 11,718 | 58.87% | 18,019 | 2.85% | 872 | 30,609 |
| Clinton County | 46.03% | 5,521 | 50.56% | 6,064 | 3.41% | 409 | 11,994 |
| Columbia County | 40.99% | 8,975 | 55.24% | 12,095 | 3.76% | 824 | 21,894 |
| Crawford County | 39.76% | 13,250 | 56.59% | 18,858 | 3.64% | 1,213 | 33,321 |
| Cumberland County | 35.26% | 31,053 | 62.23% | 54,802 | 2.51% | 2,207 | 88,062 |
| Dauphin County | 44.10% | 44,390 | 53.28% | 53,631 | 2.62% | 2,637 | 100,658 |
| Delaware County | 54.36% | 134,861 | 42.66% | 105,836 | 2.97% | 7,380 | 248,077 |
| Elk County | 42.38% | 5,754 | 54.11% | 7,347 | 3.51% | 477 | 13,578 |
| Erie County | 52.88% | 59,399 | 43.64% | 49,027 | 3.48% | 3,909 | 112,335 |
| Fayette County | 56.84% | 28,152 | 40.40% | 20,013 | 2.76% | 1,367 | 49,532 |
| Forest County | 36.93% | 843 | 60.05% | 1,371 | 3.02% | 69 | 2,283 |
| Franklin County | 30.47% | 14,922 | 67.48% | 33,042 | 2.05% | 1,005 | 48,969 |
| Fulton County | 26.96% | 1,425 | 71.01% | 3,753 | 2.02% | 107 | 5,285 |
| Greene County | 53.03% | 7,230 | 43.20% | 5,890 | 3.77% | 514 | 13,634 |
| Huntingdon County | 31.79% | 5,073 | 65.23% | 10,408 | 2.98% | 476 | 15,957 |
| Indiana County | 43.52% | 13,667 | 53.50% | 16,799 | 2.98% | 935 | 31,401 |
| Jefferson County | 31.67% | 5,566 | 65.28% | 11,473 | 3.04% | 535 | 17,574 |
| Juniata County | 30.64% | 2,656 | 66.86% | 5,795 | 2.49% | 216 | 8,667 |
| Lackawanna County | 59.63% | 57,471 | 36.41% | 35,096 | 3.96% | 3,814 | 96,381 |
| Lancaster County | 31.35% | 54,968 | 66.11% | 115,900 | 2.54% | 4,449 | 175,317 |
| Lawrence County | 51.95% | 20,593 | 45.56% | 18,060 | 2.49% | 987 | 39,640 |
| Lebanon County | 35.08% | 16,093 | 62.19% | 28,534 | 2.73% | 1,253 | 45,880 |
| Lehigh County | 48.73% | 56,667 | 47.72% | 55,492 | 3.54% | 4,121 | 116,280 |
| Luzerne County | 52.01% | 62,199 | 43.76% | 52,328 | 4.23% | 5,059 | 119,586 |
| Lycoming County | 33.96% | 14,663 | 62.84% | 27,137 | 3.20% | 1,383 | 43,183 |
| McKean County | 34.86% | 5,510 | 61.13% | 9,661 | 4.01% | 633 | 15,804 |
| Mercer County | 48.88% | 23,817 | 47.47% | 23,132 | 3.64% | 1,776 | 48,725 |
| Mifflin County | 33.08% | 4,835 | 64.32% | 9,400 | 2.59% | 379 | 14,614 |
| Monroe County | 46.80% | 21,939 | 49.63% | 23,265 | 3.57% | 1,674 | 46,878 |
| Montgomery County | 53.54% | 177,990 | 43.81% | 145,623 | 2.65% | 8,809 | 332,422 |
| Montour County | 36.29% | 2,356 | 61.00% | 3,960 | 2.71% | 176 | 6,492 |
| Northampton County | 50.72% | 53,097 | 45.27% | 47,396 | 4.01% | 4,197 | 104,690 |
| Northumberland County | 41.11% | 13,670 | 54.56% | 18,142 | 4.33% | 1,439 | 33,251 |
| Perry County | 27.75% | 4,459 | 69.59% | 11,184 | 2.66% | 428 | 16,071 |
| Philadelphia County | 80.04% | 449,182 | 17.99% | 100,959 | 1.97% | 11,039 | 561,180 |
| Pike County | 42.21% | 7,330 | 53.78% | 9,339 | 4.0% | 695 | 17,364 |
| Potter County | 28.73% | 2,037 | 68.52% | 4,858 | 2.75% | 195 | 7,090 |
| Schuylkill County | 44.97% | 26,215 | 51.19% | 29,841 | 3.85% | 2,244 | 58,300 |
| Snyder County | 27.54% | 3,536 | 69.80% | 8,963 | 2.66% | 342 | 12,841 |
| Somerset County | 36.47% | 12,028 | 61.29% | 20,218 | 2.24% | 739 | 32,985 |
| Sullivan County | 34.33% | 1,066 | 62.09% | 1,928 | 3.57% | 111 | 3,105 |
| Susquehanna County | 37.53% | 6,481 | 59.21% | 10,226 | 3.27% | 564 | 17,271 |
| Tioga County | 31.26% | 4,617 | 65.22% | 9,635 | 3.52% | 520 | 14,772 |
| Union County | 31.95% | 4,209 | 64.69% | 8,523 | 3.36% | 443 | 13,175 |
| Venango County | 39.94% | 8,196 | 56.73% | 11,642 | 3.34% | 685 | 20,523 |
| Warren County | 42.97% | 7,537 | 52.96% | 9,290 | 4.07% | 714 | 17,541 |
| Washington County | 53.25% | 44,961 | 44.22% | 37,339 | 2.54% | 2,141 | 84,441 |
| Wayne County | 36.50% | 6,904 | 59.22% | 11,201 | 4.28% | 809 | 18,914 |
| Westmoreland County | 45.81% | 71,792 | 51.60% | 80,858 | 2.59% | 4,059 | 156,709 |
| Wyoming County | 37.31% | 4,363 | 59.20% | 6,922 | 3.49% | 408 | 11,693 |
| York County | 36.02% | 51,958 | 60.77% | 87,652 | 3.21% | 4,634 | 144,244 |
By congressional district
Gore won 11 of 21 congressional districts. Gore won 3 that elected republican representatives while Bush won 2 that elected democrats.[5]
| District | Bush | Gore | Representative |
|---|---|---|---|
| 1st | 13% | 85% | Bob Brady |
| 2nd | 11% | 88% | Chaka Fattah |
| 3rd | 31% | 66% | Robert Borski |
| 4th | 51% | 47% | Ron Klink |
| Melissa Hart | |||
| 5th | 59% | 38% | John E. Peterson |
| 6th | 53% | 44% | Tim Holden |
| 7th | 47% | 50% | Curt Weldon |
| 8th | 47% | 50% | James C. Greenwood |
| 9th | 65% | 32% | Bud Shuster |
| 10th | 50% | 47% | Don Sherwood |
| 11th | 47% | 49% | Paul Kanjorski |
| 12th | 52% | 45% | John Murtha |
| 13th | 43% | 54% | Joe Hoeffel |
| 14th | 35% | 62% | William J. Coyne |
| 15th | 47% | 49% | Pat Toomey |
| 16th | 58% | 39% | Joe Pitts |
| 17th | 60% | 37% | George Gekas |
| 18th | 41% | 57% | Michael F. Doyle |
| 19th | 61% | 36% | William F. Goodling |
| Todd Platts | |||
| 20th | 46% | 51% | Frank Mascara |
| 21st | 49% | 48% | Phil English |
References
- ↑ https://www.pbs.org/newshour/bb/politics/july-dec00/pennsylvania_10-9.html
- ↑ http://uselectionatlas.org/RESULTS/state.php?year=2000&fips=42&f=0&off=0&elect=0
- ↑ http://presidentelect.org/e2000.html
- ↑ http://uselectionatlas.org/RESULTS/index.html
- ↑ https://raw.githubusercontent.com/openelections/openelections-data-pa/master/2000/20001107__pa__general__precinct.csv
See also
| Candidates | 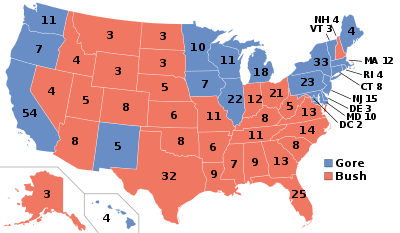 | |
|---|---|---|
| General articles | ||
| Local results |
| |
| Other 2000 elections | ||