United States presidential election in Missouri, 2000
|
| ||||||||||||||||||||||||||
| ||||||||||||||||||||||||||
| ||||||||||||||||||||||||||
 County Results
| ||||||||||||||||||||||||||
| ||||||||||||||||||||||||||

| Elections in Missouri | ||||||||||||||||
|---|---|---|---|---|---|---|---|---|---|---|---|---|---|---|---|---|
 | ||||||||||||||||
|
||||||||||||||||
|
||||||||||||||||
|
||||||||||||||||
|
|
||||||||||||||||
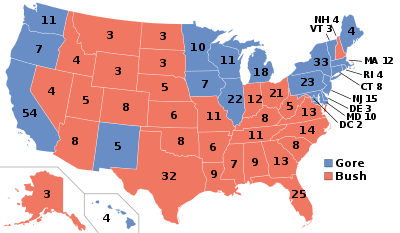
As part of the 2000 United States presidential election the state of Missouri chose 11 electors to the Electoral College, who voted for president and vice president.
Missouri was a critical swing state.[1] George W. Bush won the popular vote by a margin of just over 3% against his Democratic challenger, Al Gore. President Bush mored than doubled his 2000 election margin of victory in 2004 over his subsequent challenger, John Kerry. The 2000 election was seen as the turning point of Missouri’s bellwether status, which the state had maintained throughout most of the 20th century.
Like Clinton, Gore was a Southern Democrat from a neighboring state of Missouri—Arkansas and Tennessee, respectively—and was widely seen as competitive in the state.[2]
As of the 2016 presidential election, no Democratic presidential candidate has won Missouri since 1996, despite Al Gore (as vice president), and Hillary Clinton (as First Lady) both being important officials in the Clinton Administration. (Later Democratic nominees John Kerry and Barack Obama were not involved in the Clinton Administration).
As of the 2016 presidential election, this is the last time that Saline County, New Madrid County, Pemiscot County, Mississippi County, Ray County, and Clay County voted for the Democratic presidential candidate.
Primaries
Results
| Presidential Candidate | Running Mate | Party | Electoral Vote (EV) | Popular Vote (PV) | |
|---|---|---|---|---|---|
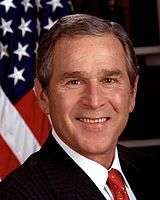
| George W. Bush of Texas | Richard Cheney of Wyoming | Republican | 11[3] | 1,189,924 | 50.42% |
| Al Gore of Tennessee | Joseph Lieberman of Connecticut | Democrat | 0 | 1,111,138 | 47.08% |
| Ralph Nader | Winona LaDuke | Green Party | 0 | 38,515 | 1.63% |
| Patrick Buchanan | Ezola Foster | Reform Party | 0 | 9,818 | 0.42% |
| Harry Browne | Art Olivier | Libertarian Party | 0 | 7,436 | 0.32% |
| Others | - | - | 0 | 3,061 | 0.13% |
By county
| County | Gore% | Gore# | Bush% | Bush# | Others% | Others# | Total |
|---|---|---|---|---|---|---|---|
| Adair County | 38.86% | 4,101 | 57.34% | 6,050 | 3.8% | 401 | 10,552 |
| Andrew County | 38.42% | 2,795 | 58.52% | 4,257 | 3.05% | 222 | 7,274 |
| Atchison County | 35.28% | 1,013 | 62.63% | 1,798 | 2.09% | 60 | 2,871 |
| Audrain County | 45.58% | 4,551 | 52.64% | 5,256 | 1.78% | 178 | 9,985 |
| Barry County | 33.43% | 4,135 | 63.75% | 7,885 | 2.81% | 348 | 12,368 |
| Barton County | 26.54% | 1,424 | 71.49% | 3,836 | 1.98% | 106 | 5,366 |
| Bates County | 43.45% | 3,386 | 54.48% | 4,245 | 2.07% | 161 | 7,792 |
| Benton County | 41.81% | 3,150 | 55.99% | 4,218 | 2.2% | 166 | 7,534 |
| Bollinger County | 31.96% | 1,692 | 65.87% | 3,487 | 2.17% | 115 | 5,294 |
| Boone County | 48.33% | 28,811 | 47.69% | 28,426 | 3.98% | 2,372 | 59,609 |
| Buchanan County | 49.16% | 17,085 | 47.26% | 16,423 | 3.58% | 1,243 | 34,751 |
| Butler County | 34.70% | 4,996 | 63.28% | 9,111 | 2.01% | 290 | 14,397 |
| Caldwell County | 38.65% | 1,488 | 57.66% | 2,220 | 3.69% | 142 | 3,850 |
| Callaway County | 43.82% | 6,708 | 53.81% | 8,238 | 2.36% | 362 | 15,308 |
| Camden County | 36.98% | 6,323 | 60.58% | 10,358 | 2.44% | 418 | 17,099 |
| Cape Girardeau County | 31.26% | 9,334 | 66.42% | 19,832 | 2.32% | 693 | 29,859 |
| Carroll County | 35.36% | 1,620 | 62.87% | 2,880 | 1.77% | 81 | 4,581 |
| Carter County | 35.51% | 997 | 61.61% | 1,730 | 2.88% | 81 | 2,808 |
| Cass County | 41.60% | 14,921 | 56.07% | 20,113 | 2.33% | 835 | 35,869 |
| Cedar County | 34.95% | 1,979 | 62.33% | 3,530 | 2.72% | 154 | 5,663 |
| Chariton County | 43.14% | 1,792 | 55.37% | 2,300 | 1.49% | 62 | 4,154 |
| Christian County | 33.99% | 7,896 | 63.82% | 14,824 | 2.19% | 508 | 23,228 |
| Clark County | 47.66% | 1,812 | 49.95% | 1,899 | 2.39% | 91 | 3,802 |
| Clay County | 48.75% | 39,084 | 48.75% | 39,083 | 2.5% | 2,006 | 80,173 |
| Clinton County | 46.82% | 3,994 | 50.67% | 4,323 | 2.51% | 214 | 8,531 |
| Cole County | 36.78% | 12,056 | 61.53% | 20,167 | 1.68% | 552 | 32,775 |
| Cooper County | 37.81% | 2,567 | 59.97% | 4,072 | 2.22% | 151 | 6,790 |
| Crawford County | 40.35% | 3,350 | 57.26% | 4,754 | 2.38% | 198 | 8,302 |
| Dade County | 31.80% | 1,193 | 65.78% | 2,468 | 2.43% | 91 | 3,752 |
| Dallas County | 37.16% | 2,311 | 59.86% | 3,723 | 2.97% | 185 | 6,219 |
| Daviess County | 39.12% | 1,367 | 57.56% | 2,011 | 3.32% | 116 | 3,494 |
| DeKalb County | 38.58% | 1,562 | 58.36% | 2,363 | 3.06% | 124 | 4,049 |
| Dent County | 30.71% | 1,839 | 66.73% | 3,996 | 2.56% | 153 | 5,988 |
| Douglas County | 29.27% | 1,546 | 68.15% | 3,599 | 2.58% | 136 | 5,281 |
| Dunklin County | 47.00% | 4,947 | 51.55% | 5,426 | 1.44% | 152 | 10,525 |
| Franklin County | 41.26% | 16,172 | 55.78% | 21,863 | 2.96% | 1,159 | 39,194 |
| Gasconade County | 34.05% | 2,257 | 63.21% | 4,190 | 2.75% | 182 | 6,629 |
| Gentry County | 40.93% | 1,271 | 57.04% | 1,771 | 2.03% | 63 | 3,105 |
| Greene County | 39.92% | 41,091 | 57.50% | 59,178 | 2.58% | 2,657 | 102,926 |
| Grundy County | 33.20% | 1,563 | 63.21% | 2,976 | 3.59% | 169 | 4,708 |
| Harrison County | 33.27% | 1,328 | 63.94% | 2,552 | 2.78% | 111 | 3,991 |
| Henry County | 45.60% | 4,459 | 52.36% | 5,120 | 2.04% | 199 | 9,778 |
| Hickory County | 46.27% | 1,961 | 51.25% | 2,172 | 2.48% | 105 | 4,238 |
| Holt County | 32.72% | 871 | 65.29% | 1,738 | 1.99% | 53 | 2,662 |
| Howard County | 43.09% | 1,944 | 53.50% | 2,414 | 3.41% | 154 | 4,512 |
| Howell County | 32.97% | 4,641 | 64.07% | 9,018 | 2.96% | 416 | 14,075 |
| Iron County | 46.31% | 2,044 | 50.68% | 2,237 | 3.01% | 133 | 4,414 |
| Jackson County | 58.96% | 160,419 | 38.38% | 104,418 | 2.66% | 7,225 | 272,062 |
| Jasper County | 31.31% | 11,737 | 66.43% | 24,899 | 2.25% | 845 | 37,481 |
| Jefferson County | 50.02% | 38,616 | 47.62% | 36,766 | 2.36% | 1,822 | 77,204 |
| Johnson County | 41.26% | 6,926 | 55.63% | 9,339 | 3.11% | 522 | 16,787 |
| Knox County | 38.30% | 787 | 59.66% | 1,226 | 2.04% | 42 | 2,055 |
| Laclede County | 32.06% | 4,183 | 65.58% | 8,556 | 2.35% | 307 | 13,046 |
| Lafayette County | 43.68% | 6,343 | 54.06% | 7,849 | 2.26% | 328 | 14,520 |
| Lawrence County | 32.82% | 4,235 | 64.36% | 8,305 | 2.81% | 363 | 12,903 |
| Lewis County | 45.12% | 2,023 | 53.26% | 2,388 | 1.63% | 73 | 4,484 |
| Lincoln County | 43.74% | 6,961 | 53.72% | 8,549 | 2.53% | 403 | 15,913 |
| Linn County | 44.03% | 2,646 | 54.01% | 3,246 | 1.96% | 118 | 6,010 |
| Livingston County | 38.64% | 2,425 | 59.10% | 3,709 | 2.26% | 142 | 6,276 |
| Macon County | 39.26% | 2,817 | 58.98% | 4,232 | 1.76% | 126 | 7,175 |
| Madison County | 41.80% | 1,828 | 56.25% | 2,460 | 1.94% | 85 | 4,373 |
| Maries County | 40.32% | 1,554 | 57.50% | 2,216 | 2.18% | 84 | 3,854 |
| Marion County | 42.63% | 4,993 | 55.93% | 6,550 | 1.44% | 169 | 11,712 |
| McDonald County | 28.58% | 1,866 | 68.31% | 4,460 | 3.11% | 203 | 6,529 |
| Mercer County | 30.13% | 555 | 67.86% | 1,250 | 2.01% | 37 | 1,842 |
| Miller County | 34.38% | 3,217 | 63.54% | 5,945 | 2.07% | 194 | 9,356 |
| Mississippi County | 52.85% | 2,756 | 45.93% | 2,395 | 1.23% | 64 | 5,215 |
| Moniteau County | 35.88% | 2,176 | 62.06% | 3,764 | 2.06% | 125 | 6,065 |
| Monroe County | 45.43% | 1,860 | 53.13% | 2,175 | 1.44% | 59 | 4,094 |
| Montgomery County | 39.45% | 2,092 | 58.57% | 3,106 | 1.98% | 105 | 5,303 |
| Morgan County | 41.05% | 3,235 | 56.59% | 4,460 | 2.36% | 186 | 7,881 |
| New Madrid County | 51.45% | 3,738 | 47.01% | 3,416 | 1.54% | 112 | 7,266 |
| Newton County | 30.46% | 6,447 | 67.25% | 14,232 | 2.28% | 483 | 21,162 |
| Nodaway County | 39.26% | 3,553 | 57.03% | 5,161 | 3.7% | 335 | 9,049 |
| Oregon County | 37.04% | 1,568 | 59.56% | 2,521 | 3.4% | 144 | 4,233 |
| Osage County | 31.37% | 1,938 | 67.24% | 4,154 | 1.39% | 86 | 6,178 |
| Ozark County | 33.36% | 1,432 | 62.05% | 2,663 | 4.59% | 197 | 4,292 |
| Pemiscot County | 53.55% | 3,245 | 45.38% | 2,750 | 1.07% | 65 | 6,060 |
| Perry County | 30.20% | 2,085 | 67.61% | 4,667 | 2.19% | 151 | 6,903 |
| Pettis County | 37.16% | 5,855 | 60.51% | 9,533 | 2.33% | 367 | 15,755 |
| Phelps County | 38.78% | 6,262 | 58.49% | 9,444 | 2.73% | 440 | 16,146 |
| Pike County | 48.39% | 3,557 | 49.63% | 3,648 | 1.99% | 146 | 7,351 |
| Platte County | 45.00% | 15,325 | 52.23% | 17,785 | 2.77% | 944 | 34,054 |
| Polk County | 35.03% | 3,606 | 62.46% | 6,430 | 2.51% | 258 | 10,294 |
| Pulaski County | 36.08% | 3,800 | 62.02% | 6,531 | 1.9% | 200 | 10,531 |
| Putnam County | 30.33% | 708 | 68.25% | 1,593 | 1.41% | 33 | 2,334 |
| Ralls County | 44.76% | 2,033 | 53.85% | 2,446 | 1.39% | 63 | 4,542 |
| Randolph County | 44.81% | 4,116 | 52.73% | 4,844 | 2.46% | 226 | 9,186 |
| Ray County | 50.99% | 4,970 | 46.34% | 4,517 | 2.67% | 260 | 9,747 |
| Reynolds County | 41.46% | 1,298 | 56.28% | 1,762 | 2.27% | 71 | 3,131 |
| Ripley County | 35.93% | 1,820 | 61.62% | 3,121 | 2.45% | 124 | 5,065 |
| Saline County | 49.01% | 4,585 | 48.87% | 4,572 | 2.12% | 198 | 9,355 |
| Schuyler County | 40.28% | 808 | 57.78% | 1,159 | 1.94% | 39 | 2,006 |
| Scotland County | 36.26% | 790 | 61.27% | 1,335 | 2.48% | 54 | 2,179 |
| Scott County | 41.09% | 6,452 | 57.30% | 8,999 | 1.61% | 253 | 15,704 |
| Shannon County | 37.82% | 1,430 | 59.38% | 2,245 | 2.8% | 106 | 3,781 |
| Shelby County | 38.75% | 1,262 | 59.44% | 1,936 | 1.81% | 59 | 3,257 |
| St. Charles County | 41.81% | 53,806 | 56.04% | 72,114 | 2.15% | 2,766 | 128,686 |
| St. Clair County | 39.38% | 1,866 | 57.63% | 2,731 | 3.% | 142 | 4,739 |
| St. Francois County | 48.17% | 9,075 | 49.50% | 9,327 | 2.33% | 439 | 18,841 |
| St. Louis County | 77.40% | 96,557 | 19.88% | 24,799 | 2.72% | 3,396 | 124,752 |
| St. Louis City | 51.48% | 250,631 | 46.15% | 224,689 | 2.38% | 11,564 | 486,884 |
| Ste. Genevieve County | 49.24% | 3,600 | 47.94% | 3,505 | 2.82% | 206 | 7,311 |
| Stoddard County | 35.94% | 4,476 | 62.04% | 7,727 | 2.02% | 251 | 12,454 |
| Stone County | 33.37% | 4,055 | 64.13% | 7,793 | 2.49% | 303 | 12,151 |
| Sullivan County | 36.78% | 1,127 | 61.26% | 1,877 | 1.96% | 60 | 3,064 |
| Taney County | 33.70% | 5,092 | 63.84% | 9,647 | 2.47% | 373 | 15,112 |
| Texas County | 35.10% | 3,486 | 61.78% | 6,136 | 3.12% | 310 | 9,932 |
| Vernon County | 37.54% | 3,156 | 59.29% | 4,985 | 3.18% | 267 | 8,408 |
| Warren County | 42.12% | 4,524 | 55.67% | 5,979 | 2.21% | 237 | 10,740 |
| Washington County | 48.97% | 4,047 | 48.64% | 4,020 | 2.4% | 198 | 8,265 |
| Wayne County | 40.82% | 2,387 | 57.22% | 3,346 | 1.97% | 115 | 5,848 |
| Webster County | 35.13% | 4,174 | 61.87% | 7,350 | 3.% | 356 | 11,880 |
| Worth County | 40.50% | 469 | 56.22% | 651 | 3.28% | 38 | 1,158 |
| Wright County | 28.70% | 2,250 | 68.75% | 5,391 | 2.55% | 200 | 7,841 |
Electors
Technically the voters of Missouri cast their ballots for electors: representatives to the Electoral College. Missouri is allocated 11 electors because it has 9 congressional districts and 2 senators. All candidates who appear on the ballot or qualify to receive write-in votes must submit a list of 11 electors, who pledge to vote for their candidate and his or her running mate. Whoever wins the majority of votes in the state is awarded all 11 electoral votes. Their chosen electors then vote for president and vice president. Although electors are pledged to their candidate and running mate, they are not obligated to vote for them. An elector who votes for someone other than his or her candidate is known as a faithless elector.
The electors of each state and the District of Columbia met on December 18, 2000[4] to cast their votes for president and vice president. The Electoral College itself never meets as one body. Instead the electors from each state and the District of Columbia met in their respective capitols.
The following were the members of the Electoral College from the state. All were pledged to and voted for George W. Bush and Dick Cheney:[5]
- David Barklage
- Bruce Bredeman
- Marc Ellinger
- Gordon Elliott
- John Hancock
- Stan Horacek
- Homer Johnson
- John Judd
- Michael Kort
- Dennis Owens
- Al Rotskoff
Missouri Bellwether
Beginning with the 2000 election, the status of the Missouri bellwether came into question. Between 1904 and 2004, Missouri was carried by the victor of each presidential election, with the exception of 1956. Though Bush won the presidency in the 2000 election through the Electoral College, he lost the national popular vote. The 2000 election was unique because this was the first time in over a century where the popular vote winner lost the general election. (In 1888, Missouri voted for Grover Cleveland, the incumbent Democrat, who lost to Republican candidate Benjamin Harrison). Thus, controversy exists as to whether or not Missouri accurately predicted victor in this election. In the subsequent election, Missouri voted for George W. Bush, who this time won both the popular vote and the Electoral College. Missouri has voted reliably Republican since 2000. The state voted for John McCain in 2008, and for Mitt Romney in 2012, both of whom lost the general election to Barack Obama. The controversy is further complicated by the 2016 presidential election, where Missouri voted for Donald Trump by a landslide, while Hillary Clinton won the popular vote by nearly three million votes, but like in 2000, Trump won the Electoral College and became 45th President of the United States. Like 2000, political scientists have differing opinions on whether or not Missouri accurately predicted the victor, and even if Missouri is still a bellwether state at all.
References
- ↑ http://www.highbeam.com/doc/1G1-62411569.html
- ↑ "THE 2000 CAMPAIGN: THE MISSOURI CAMPAIGN; A Bellwether State's Favor Is Pursued by Both Tickets". mobile.nytimes.com. Retrieved 2017-12-17.
- ↑ 2000 Presidential General Election Results - Missouri
- ↑ http://www.uselectionatlas.org/INFORMATION/ARTICLES/pe2000timeline.php
- ↑ http://presidentelect.org/e2000.html