The 2000 United States presidential election in Virginia took place on November 7, 2000, and was part of the 2000 United States presidential election. Voters chose 13 representatives, or electors to the Electoral College, who voted for president and vice president.
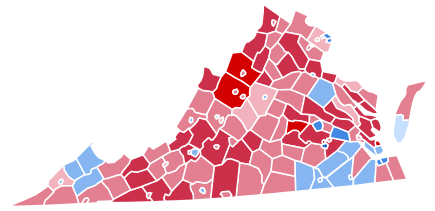
Virginia, a state that hadn't gone Democratic since 1964, was won by Governor George W. Bush with a margin of victory of 8%. It would not vote Democratic again until 2008. The 2000 election was the last time Fairfax County, Virginia's most populous county, would go Republican. Fairfax's switch to the Democrats in recent years has resulted in the state turning Democratic.
Primaries
- Virginia Democratic primary, 2000
- Virginia Republican primary, 2000
Results
| United States presidential election in Virginia, 2000[3] |
| Party |
Candidate |
Running mate |
Votes |
Percentage |
Electoral votes |
|
Republican |
George W. Bush |
Dick Cheney |
1,437,490 |
52.47% |
13 |
|
Democratic |
Al Gore |
Joe Lieberman |
1,217,290 |
44.44% |
0 |
|
Green |
Ralph Nader |
Winona LaDuke |
59,398 |
2.17% |
0 |
|
Libertarian |
Harry Browne |
Art Olivier |
15,198 |
0.55% |
0 |
|
Reform |
Pat Buchanan |
Ezola Foster |
5,455 |
0.20% |
0 |
|
Constitution |
Howard Phillips |
Curtis Frazier |
1,809 |
0.07% |
0 |
|
Write-ins |
Write-ins |
- |
2,807 |
0.10% |
0 |
|
| Totals |
2,739,447 |
100.00% |
13 |
| Voter turnout |
??? |
— |
Results breakdown
By county/city
| County/City |
Gore% |
Gore# |
Bush% |
Bush# |
Others% |
Others# |
Total |
| Accomack County | 42.70% | 5,092 | 53.27% | 6,352 | 4.03% | 481 | 11,925 |
| Albemarle County | 43.42% | 16,255 | 50.54% | 18,921 | 6.04% | 2,262 | 37,438 |
| Alleghany County | 43.22% | 2,214 | 54.81% | 2,808 | 1.97% | 101 | 5,123 |
| Amelia County | 36.64% | 1,754 | 61.56% | 2,947 | 1.80% | 86 | 4,787 |
| Amherst County | 41.10% | 4,812 | 56.88% | 6,660 | 2.02% | 236 | 11,708 |
| Appomattox County | 35.97% | 2,132 | 61.65% | 3,654 | 2.38% | 141 | 5,927 |
| Arlington County | 60.25% | 50,260 | 34.23% | 28,555 | 5.52% | 4,601 | 83,416 |
| Augusta County | 26.29% | 6,643 | 70.22% | 17,744 | 3.49% | 882 | 25,269 |
| Bath County | 37.19% | 822 | 59.32% | 1,311 | 3.48% | 77 | 2,210 |
| Bedford County | 31.21% | 8,160 | 65.87% | 17,224 | 2.93% | 765 | 26,149 |
| Bland County | 31.66% | 851 | 65.44% | 1,759 | 2.90% | 78 | 2,688 |
| Botetourt County | 33.43% | 4,627 | 64.07% | 8,867 | 2.50% | 346 | 13,840 |
| Brunswick County | 56.48% | 3,387 | 42.70% | 2,561 | 0.82% | 49 | 5,997 |
| Buchanan County | 58.29% | 5,745 | 39.23% | 3,867 | 2.48% | 244 | 9,856 |
| Buckingham County | 46.96% | 2,561 | 50.20% | 2,738 | 2.84% | 155 | 5,454 |
| Campbell County | 32.76% | 6,659 | 64.76% | 13,162 | 2.47% | 503 | 20,324 |
| Caroline County | 51.66% | 4,314 | 46.38% | 3,873 | 1.95% | 163 | 8,350 |
| Carroll County | 33.07% | 3,638 | 64.92% | 7,142 | 2.01% | 221 | 11,001 |
| Charles City County | 64.61% | 1,981 | 33.37% | 1,023 | 2.02% | 62 | 3,066 |
| Charlotte County | 40.40% | 2,017 | 57.18% | 2,855 | 2.42% | 121 | 4,993 |
| Chesterfield County | 34.90% | 38,638 | 63.16% | 69,924 | 1.94% | 2,150 | 110,712 |
| Clarke County | 41.01% | 2,166 | 54.58% | 2,883 | 4.41% | 233 | 5,282 |
| Craig County | 34.14% | 851 | 63.38% | 1,580 | 2.49% | 62 | 2,493 |
| Culpeper County | 35.65% | 4,364 | 60.77% | 7,440 | 3.58% | 438 | 12,242 |
| Cumberland County | 40.06% | 1,405 | 56.29% | 1,974 | 3.65% | 128 | 3,507 |
| Dickenson County | 54.68% | 3,951 | 43.21% | 3,122 | 2.12% | 153 | 7,226 |
| Dinwiddie County | 43.79% | 4,001 | 54.28% | 4,959 | 1.93% | 176 | 9,136 |
| Essex County | 45.68% | 1,750 | 52.08% | 1,995 | 2.24% | 86 | 3,831 |
| Fairfax County | 47.54% | 196,501 | 48.91% | 202,181 | 3.55% | 14,656 | 413,338 |
| Fauquier County | 35.38% | 8,296 | 61.66% | 14,456 | 2.96% | 694 | 23,446 |
| Floyd County | 34.11% | 1,957 | 59.65% | 3,423 | 6.24% | 358 | 5,738 |
| Fluvanna County | 39.42% | 3,431 | 57.01% | 4,962 | 3.56% | 310 | 8,703 |
| Franklin County | 37.95% | 7,145 | 59.62% | 11,225 | 2.44% | 459 | 18,829 |
| Frederick County | 31.98% | 7,158 | 65.10% | 14,574 | 2.92% | 654 | 22,386 |
| Giles County | 44.05% | 3,004 | 52.40% | 3,574 | 3.55% | 242 | 6,820 |
| Gloucester County | 33.24% | 4,553 | 63.64% | 8,718 | 3.12% | 427 | 13,698 |
| Goochland County | 45.35% | 3,197 | 51.83% | 3,654 | 2.82% | 199 | 7,050 |
| Grayson County | 36.01% | 2,467 | 61.83% | 4,236 | 2.16% | 148 | 6,851 |
| Greene County | 32.80% | 1,774 | 62.41% | 3,375 | 4.79% | 259 | 5,408 |
| Greensville County | 59.24% | 2,314 | 40.07% | 1,565 | 0.69% | 27 | 3,906 |
| Halifax County | 42.37% | 5,963 | 54.95% | 7,732 | 2.68% | 377 | 14,072 |
| Hanover County | 28.97% | 12,044 | 68.83% | 28,614 | 2.20% | 915 | 41,573 |
| Henrico County | 42.68% | 48,645 | 55.18% | 62,887 | 2.14% | 2,444 | 113,976 |
| Henry County | 41.46% | 8,898 | 55.31% | 11,870 | 3.23% | 694 | 21,462 |
| Highland County | 31.52% | 453 | 65.55% | 942 | 2.92% | 42 | 1,437 |
| Isle of Wight County | 39.89% | 5,162 | 58.63% | 7,587 | 1.48% | 191 | 12,940 |
| James City County | 37.14% | 9,090 | 59.77% | 14,628 | 3.09% | 757 | 24,475 |
| King and Queen County | 48.51% | 1,387 | 49.77% | 1,423 | 1.71% | 49 | 2,859 |
| King George County | 35.41% | 2,070 | 61.41% | 3,590 | 3.18% | 186 | 5,846 |
| King William County | 36.84% | 2,125 | 61.49% | 3,547 | 1.66% | 96 | 5,768 |
| Lancaster County | 35.52% | 1,937 | 62.54% | 3,411 | 1.94% | 106 | 5,454 |
| Lee County | 46.08% | 4,031 | 52.02% | 4,551 | 1.90% | 166 | 8,748 |
| Loudoun County | 40.98% | 30,938 | 56.23% | 42,453 | 2.80% | 2,112 | 75,503 |
| Louisa County | 42.70% | 4,309 | 54.12% | 5,461 | 3.18% | 321 | 10,091 |
| Lunenburg County | 44.13% | 2,026 | 54.67% | 2,510 | 1.20% | 55 | 4,591 |
| Madison County | 36.70% | 1,844 | 58.51% | 2,940 | 4.80% | 241 | 5,025 |
| Mathews County | 32.52% | 1,499 | 64.03% | 2,951 | 3.45% | 159 | 4,609 |
| Mecklenburg County | 40.95% | 4,797 | 56.86% | 6,660 | 2.19% | 256 | 11,713 |
| Middlesex County | 35.65% | 1,671 | 60.68% | 2,844 | 3.67% | 172 | 4,687 |
| Montgomery County | 43.16% | 11,720 | 51.53% | 13,991 | 5.31% | 1,442 | 27,153 |
| Nelson County | 47.35% | 2,907 | 47.45% | 2,913 | 5.20% | 319 | 6,139 |
| New Kent County | 33.68% | 2,055 | 64.47% | 3,934 | 1.85% | 113 | 6,102 |
| Northampton County | 47.83% | 2,340 | 47.00% | 2,299 | 5.17% | 253 | 4,892 |
| Northumberland County | 37.80% | 2,118 | 60.00% | 3,362 | 2.20% | 123 | 5,603 |
| Nottoway County | 44.79% | 2,460 | 52.26% | 2,870 | 2.95% | 162 | 5,492 |
| Orange County | 34.11% | 2,726 | 63.68% | 5,089 | 2.21% | 177 | 7,992 |
| Page County | 30.52% | 2,254 | 66.36% | 4,901 | 3.11% | 230 | 7,385 |
| Patrick County | 30.52% | 2,254 | 66.36% | 4,901 | 3.11% | 230 | 7,385 |
| Pittsylvania County | 27.89% | 2,708 | 70.25% | 6,820 | 1.85% | 180 | 9,708 |
| Powhatan County | 45.92% | 2,922 | 50.51% | 3,214 | 3.57% | 227 | 6,363 |
| Prince Edward County | 38.41% | 4,182 | 60.43% | 6,579 | 1.16% | 126 | 10,887 |
| Prince George County | 44.53% | 44,745 | 52.54% | 52,788 | 2.93% | 2,945 | 100,478 |
| Prince William County | 41.40% | 5,255 | 55.85% | 7,089 | 2.76% | 350 | 12,694 |
| Pulaski County | 41.70% | 1,462 | 52.77% | 1,850 | 5.53% | 194 | 3,506 |
| Rappahannock County | 36.49% | 1,076 | 60.50% | 1,784 | 3.02% | 89 | 2,949 |
| Richmond County | 37.71% | 16,141 | 60.13% | 25,740 | 2.17% | 927 | 42,808 |
| Roanoke County | 37.75% | 2,953 | 57.80% | 4,522 | 4.45% | 348 | 7,823 |
| Rockbridge County | 24.33% | 5,834 | 72.90% | 17,482 | 2.78% | 666 | 23,982 |
| Rockingham County | 50.43% | 5,442 | 46.94% | 5,065 | 2.63% | 284 | 10,791 |
| Russell County | 38.05% | 3,552 | 59.29% | 5,535 | 2.66% | 248 | 9,335 |
| Scott County | 30.60% | 4,420 | 66.70% | 9,636 | 2.70% | 390 | 14,446 |
| Shenandoah County | 41.19% | 4,836 | 56.05% | 6,580 | 2.76% | 324 | 11,740 |
| Smyth County | 50.04% | 3,359 | 49.06% | 3,293 | 0.89% | 60 | 6,712 |
| Southampton County | 38.46% | 13,455 | 59.28% | 20,739 | 2.26% | 791 | 34,985 |
| Spotsylvania County | 93.35% | 12,596 | 00.15% | 21 | 6.49% | 876 | 13,493 |
| Stafford County | 57.12% | 1,845 | 40.65% | 1,313 | 2.23% | 72 | 3,230 |
| Surry County | 51.36% | 2,006 | 44.67% | 1,745 | 3.97% | 155 | 3,906 |
| Sussex County | 44.22% | 7,227 | 52.96% | 8,655 | 2.83% | 462 | 16,344 |
| Tazewell County | 38.69% | 4,323 | 56.69% | 6,335 | 4.62% | 516 | 11,174 |
| Warren County | 37.33% | 7,549 | 59.66% | 12,064 | 3.00% | 607 | 20,220 |
| Washington County | 38.57% | 2,737 | 57.55% | 4,084 | 3.89% | 276 | 7,097 |
| Westmoreland County | 48.49% | 2,922 | 48.66% | 2,932 | 2.85% | 172 | 6,026 |
| Wise County | 48.17% | 6,412 | 48.87% | 6,504 | 2.96% | 394 | 13,310 |
| Wythe County | 33.98% | 3,462 | 64.18% | 6,539 | 1.84% | 187 | 10,188 |
| York County | 35.09% | 8,622 | 62.32% | 15,312 | 2.58% | 634 | 24,568 |
| Alexandria | 60.93% | 33,633 | 34.50% | 19,043 | 4.57% | 2,523 | 55,199 |
| Bedford | 44.16% | 1,078 | 51.99% | 1,269 | 3.85% | 94 | 2,441 |
| Bristol | 42.14% | 2,646 | 55.66% | 3,495 | 2.20% | 138 | 6,279 |
| Buena Vista | 47.65% | 941 | 49.62% | 980 | 2.73% | 54 | 1,975 |
| Charlottesville | 58.70% | 7,762 | 30.51% | 4,034 | 10.80% | 1,428 | 13,224 |
| Chesapeake | 45.02% | 33,578 | 53.21% | 39,684 | 1.77% | 1,323 | 74,585 |
| Clifton Forge | 56.66% | 868 | 40.01% | 613 | 3.33% | 51 | 1,532 |
| Colonial Heights | 26.99% | 2,100 | 70.92% | 5,519 | 2.09% | 163 | 7,782 |
| Covington | 52.76% | 1,168 | 43.63% | 966 | 3.61% | 80 | 2,214 |
| Danville | 44.91% | 8,221 | 51.49% | 9,427 | 3.60% | 659 | 18,307 |
| Emporia | 53.65% | 1,116 | 45.10% | 938 | 1.25% | 26 | 2,080 |
| Fairfax | 45.64% | 4,361 | 49.83% | 4,762 | 4.53% | 433 | 9,556 |
| Falls Church | 55.59% | 3,109 | 38.10% | 2,131 | 6.31% | 353 | 5,593 |
| Franklin | 55.25% | 1,763 | 43.65% | 1,393 | 1.10% | 35 | 3,191 |
| Fredericksburg | 50.29% | 3,360 | 43.93% | 2,935 | 5.78% | 386 | 6,681 |
| Galax | 45.01% | 996 | 52.42% | 1,160 | 2.58% | 57 | 2,213 |
| Hampton | 57.41% | 27,490 | 40.85% | 19,561 | 1.75% | 836 | 47,887 |
| Harrisonburg | 34.97% | 3,482 | 57.65% | 5,741 | 7.38% | 735 | 9,958 |
| Hopewell | 43.34% | 3,024 | 53.73% | 3,749 | 2.94% | 205 | 6,978 |
| Lexington | 48.97% | 1,048 | 44.72% | 957 | 6.31% | 135 | 2,140 |
| Lynchburg | 44.13% | 10,374 | 53.25% | 12,518 | 2.61% | 614 | 23,506 |
| Manassas | 42.40% | 5,262 | 54.41% | 6,752 | 3.19% | 396 | 12,410 |
| Manassas Park | 40.62% | 1,048 | 56.59% | 1,460 | 2.79% | 72 | 2,580 |
| Martinsville | 53.53% | 3,048 | 44.96% | 2,560 | 1.51% | 86 | 5,694 |
| Newport News | 51.50% | 29,779 | 46.70% | 27,006 | 1.80% | 1,040 | 57,825 |
| Norfolk | 61.70% | 38,221 | 35.39% | 21,920 | 2.91% | 1,805 | 61,946 |
| Norton | 56.67% | 867 | 41.76% | 639 | 1.57% | 24 | 1,530 |
| Petersburg | 79.11% | 8,751 | 19.07% | 2,109 | 1.83% | 202 | 11,062 |
| Poquoson | 24.71% | 1,448 | 72.87% | 4,271 | 2.42% | 142 | 5,861 |
| Portsmouth | 62.86% | 22,286 | 35.62% | 12,628 | 1.53% | 541 | 35,455 |
| Radford | 46.38% | 2,063 | 49.24% | 2,190 | 4.38% | 195 | 4,448 |
| Richmond | 64.80% | 42,717 | 30.74% | 20,265 | 4.47% | 2,944 | 65,926 |
| Roanoke | 53.59% | 17,920 | 43.75% | 14,630 | 2.67% | 892 | 33,442 |
| Salem | 40.37% | 4,348 | 57.46% | 6,188 | 2.17% | 234 | 10,770 |
| Staunton | 39.04% | 3,324 | 57.29% | 4,878 | 3.66% | 312 | 8,514 |
| Suffolk | 50.57% | 12,471 | 47.99% | 11,836 | 1.44% | 354 | 24,661 |
| Virginia Beach | 41.58% | 62,268 | 55.87% | 83,674 | 2.56% | 3,829 | 149,771 |
| Waynesboro | 38.54% | 2,737 | 57.50% | 4,084 | 3.96% | 281 | 7,102 |
| Williamsburg | 46.28% | 1,724 | 47.70% | 1,777 | 6.01% | 224 | 3,725 |
| Winchester | 42.07% | 3,318 | 54.70% | 4,314 | 3.22% | 254 | 7,886 |
See also
|
|---|
| Candidates | | |
|---|
General
articles | |
|---|
Local
results | |
|---|
Other 2000
elections | |
|---|