Lac qui Parle County, Minnesota
| Lac qui Parle County, Minnesota | |
|---|---|
 | |
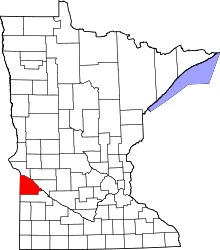 Location in the U.S. state of Minnesota | |
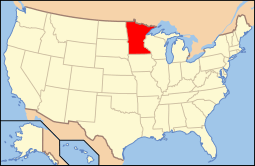 Minnesota's location in the U.S. | |
| Founded | March 6, 1871[1] |
| Named for | French for "the lake that speaks." |
| Seat | Madison |
| Largest city | Madison |
| Area | |
| • Total | 778 sq mi (2,015 km2) |
| • Land | 765 sq mi (1,981 km2) |
| • Water | 13 sq mi (34 km2), 1.7% |
| Population (est.) | |
| • (2016) | 6,715 |
| • Density | 9.5/sq mi (3.7/km2) |
| Congressional district | 7th |
| Time zone | Central: UTC−6/−5 |
| Website |
lqpco |
Lac qui Parle County is a county located in the U.S. state of Minnesota. As of the 2010 census, the population was 7,259.[2] Its county seat is Madison.[3]
History
The name of the county is French for "lake which talks."[4]
A March 2011 study by the University of Wisconsin–Madison and the Robert Wood Johnson Foundation ranked Lac qui Parle County the healthiest county in Minnesota.[5][6]
The county reached its peak population of 15,554 in 1920.
Geography
According to the U.S. Census Bureau, the county has a total area of 778 square miles (2,020 km2), of which 765 square miles (1,980 km2) is land and 13 square miles (34 km2) (1.7%) is water.[7] The county's northern boundary is defined by the Minnesota River; two of its tributaries, the Lac qui Parle River and the Yellow Bank River, also flow through the county.[8]
Lakes
- Case Lake: in Ten Mile Lake Township
- Kibler Lake: in Agassiz Township
- Lac qui Parle: Eastern border
- Pegg Lake: in Augusta Township
- Salt Lake: mostly in Mehurin Township, but the western fifth stretches into South Dakota
- Swanson Lake: western two thirds is in Maxwell Township; eastern third is in Ten Mile Lake Township
- Tenmile Lake: in Ten Mile Lake Township
Major highways
Adjacent counties
- Big Stone County, Minnesota (north)
- Swift County, Minnesota (northeast)
- Chippewa County, Minnesota (east)
- Yellow Medicine County, Minnesota (south)
- Deuel County, South Dakota (southwest)
- Grant County, South Dakota (northwest)
National protected area
Demographics
| Historical population | |||
|---|---|---|---|
| Census | Pop. | %± | |
| 1870 | 145 | — | |
| 1880 | 4,891 | 3,273.1% | |
| 1890 | 10,382 | 112.3% | |
| 1900 | 14,289 | 37.6% | |
| 1910 | 15,435 | 8.0% | |
| 1920 | 15,554 | 0.8% | |
| 1930 | 15,398 | −1.0% | |
| 1940 | 15,509 | 0.7% | |
| 1950 | 14,545 | −6.2% | |
| 1960 | 13,330 | −8.4% | |
| 1970 | 11,164 | −16.2% | |
| 1980 | 10,592 | −5.1% | |
| 1990 | 8,924 | −15.7% | |
| 2000 | 8,067 | −9.6% | |
| 2010 | 7,259 | −10.0% | |
| Est. 2016 | 6,715 | [10] | −7.5% |
| U.S. Decennial Census[11] 1790-1960[12] 1900-1990[13] 1990-2000[14] 2010-2016[2] | |||

As of the 2000 census,[15] there were 8,067 people, 3,316 households, and 2,225 families residing in the county. The population density was 10 people per square mile (4/km²). There were 3,774 housing units at an average density of 5 per square mile (2/km²). The racial makeup of the county was 98.85% White, 0.16% Black or African American, 0.22% Native American, 0.32% Asian, 0.06% from other races, and 0.38% from two or more races. 0.26% of the population were Hispanic or Latino of any race. 44.6% were of Norwegian and 35.2% German ancestry.
There were 3,316 households out of which 27.90% had children under the age of 18 living with them, 59.80% were married couples living together, 4.10% had a female householder with no husband present, and 32.90% were non-families. 30.20% of all households were made up of individuals and 17.90% had someone living alone who was 65 years of age or older. The average household size was 2.37 and the average family size was 2.96.
In the county, the population was spread out with 24.50% under the age of 18, 5.70% from 18 to 24, 22.70% from 25 to 44, 23.90% from 45 to 64, and 23.20% who were 65 years of age or older. The median age was 43 years. For every 100 females there were 98.60 males. For every 100 females age 18 and over, there were 95.60 males.
The median income for a household in the county was $32,626, and the median income for a family was $41,556. Males had a median income of $27,939 versus $19,681 for females. The per capita income for the county was $17,399. About 5.60% of families and 8.50% of the population were below the poverty line, including 7.80% of those under age 18 and 9.20% of those age 65 or over.
Communities
Cities
- Bellingham
- Boyd
- Dawson
- Louisburg
- Madison (county seat)
- Marietta
- Nassau
- Ortonville (partly)
Townships
- Agassiz Township
- Arena Township
- Augusta Township
- Baxter Township
- Camp Release Township
- Cerro Gordo Township
- Freeland Township
- Garfield Township
- Hamlin Township
- Hantho Township
- Lac qui Parle Township
- Lake Shore Township
- Madison Township
- Manfred Township
- Maxwell Township
- Mehurin Township
- Perry Township
- Providence Township
- Riverside Township
- Ten Mile Lake Township
- Walter Township
- Yellow Bank Township
Unincorporated communities
Politics
| Year | Republican | Democratic | Third parties |
|---|---|---|---|
| 2016 | 59.4% 2,293 | 33.8% 1,305 | 6.8% 262 |
| 2012 | 48.6% 1,938 | 49.6% 1,974 | 1.8% 72 |
| 2008 | 45.6% 1,912 | 51.5% 2,160 | 2.9% 120 |
| 2004 | 46.1% 2,093 | 52.6% 2,390 | 1.3% 58 |
| 2000 | 43.6% 1,941 | 50.4% 2,244 | 6.0% 268 |
| 1996 | 32.4% 1,447 | 54.2% 2,420 | 13.4% 598 |
| 1992 | 28.9% 1,435 | 47.1% 2,342 | 24.0% 1,191 |
| 1988 | 42.5% 2,116 | 56.3% 2,805 | 1.2% 62 |
| 1984 | 49.7% 2,731 | 48.8% 2,685 | 1.5% 81 |
| 1980 | 50.5% 2,981 | 41.6% 2,457 | 7.9% 465 |
| 1976 | 37.8% 2,292 | 60.1% 3,647 | 2.1% 126 |
| 1972 | 48.4% 2,773 | 49.7% 2,845 | 1.9% 108 |
| 1968 | 45.9% 2,672 | 50.4% 2,937 | 3.8% 219 |
| 1964 | 36.2% 2,236 | 63.7% 3,934 | 0.2% 10 |
| 1960 | 49.4% 3,185 | 50.4% 3,253 | 0.2% 11 |
| 1956 | 53.6% 3,276 | 46.3% 2,826 | 0.1% 6 |
| 1952 | 58.5% 3,924 | 41.1% 2,753 | 0.4% 28 |
| 1948 | 38.2% 2,330 | 60.5% 3,690 | 1.3% 80 |
| 1944 | 52.6% 3,104 | 47.1% 2,779 | 0.3% 17 |
| 1940 | 54.7% 3,789 | 44.9% 3,106 | 0.4% 28 |
| 1936 | 34.5% 2,066 | 54.1% 3,243 | 11.5% 687 |
| 1932 | 31.9% 1,911 | 66.5% 3,992 | 1.6% 97 |
| 1928 | 59.7% 3,406 | 39.3% 2,245 | 1.0% 59 |
| 1924 | 52.3% 2,860 | 1.9% 106 | 45.8% 2,507 |
| 1920 | 82.3% 4,219 | 12.7% 653 | 5.0% 255 |
| 1916 | 56.3% 1,614 | 36.5% 1,047 | 7.2% 206 |
| 1912 | 13.5% 343 | 24.0% 608 | 62.5% 1,587 |
| 1908 | 69.2% 1,894 | 24.1% 661 | 6.7% 183 |
| 1904 | 83.3% 1,886 | 10.7% 243 | 6.0% 136 |
| 1900 | 71.5% 1,924 | 23.9% 642 | 4.7% 126 |
| 1896 | 61.3% 1,620 | 35.3% 932 | 3.4% 89 |
| 1892 | 52.3% 1,164 | 20.5% 457 | 27.1% 604 |
See also
References
- ↑ "Minnesota Place Names". Minnesota Historical Society. Retrieved March 18, 2014.
- 1 2 "State & County QuickFacts". United States Census Bureau. Archived from the original on July 13, 2011. Retrieved September 1, 2013.
- ↑ "Find a County". National Association of Counties. Retrieved 2011-06-07.
- ↑ Warren Upham (1920). Minnesota Geographic Names: Their Origin and Historic Significance. Minnesota Historical Society. p. 288.
- ↑ Wobbema, Taryn (March 29, 2011). "How healthy are Minnesotans? It varies, report says". Star Tribune. Retrieved 2018-09-19.
- ↑ "Rankings". County Health Rankings & Roadmaps. Retrieved 2018-09-19.
- ↑ "2010 Census Gazetteer Files". United States Census Bureau. August 22, 2012. Archived from the original on September 21, 2013. Retrieved October 21, 2014.
- ↑ Minnesota Atlas & Gazetteer. Yarmouth, Me.: DeLorme. 1994. pp. 36–37. ISBN 0-89933-222-6.
- ↑ Nelson, Steven (2011). Savanna Soils of Minnesota. Minnesota: Self. pp. 69 - 70. ISBN 978-0-615-50320-2.
- ↑ "Population and Housing Unit Estimates". Retrieved June 9, 2017.
- ↑ "U.S. Decennial Census". United States Census Bureau. Retrieved October 21, 2014.
- ↑ "Historical Census Browser". University of Virginia Library. Retrieved October 21, 2014.
- ↑ "Population of Counties by Decennial Census: 1900 to 1990". United States Census Bureau. Retrieved October 21, 2014.
- ↑ "Census 2000 PHC-T-4. Ranking Tables for Counties: 1990 and 2000" (PDF). United States Census Bureau. Retrieved October 21, 2014.
- ↑ "American FactFinder". United States Census Bureau. Retrieved 2008-01-31.
- ↑ Leip, David. "Dave Leip's Atlas of U.S. Presidential Elections". uselectionatlas.org. Retrieved 2018-09-19.
External links
| Wikimedia Commons has media related to Lac qui Parle County, Minnesota. |
Places adjacent to Lac qui Parle County, Minnesota | ||||||||||
|---|---|---|---|---|---|---|---|---|---|---|
| ||||||||||
Municipalities and communities of Lac qui Parle County, Minnesota, United States | ||
|---|---|---|
| Cities | | |
| Townships | ||
| Unincorporated communities | ||
| Footnotes | ‡This populated place also has portions in an adjacent county or counties | |