United States presidential election in Louisiana, 2000
|
| ||||||||||||||||||||||||||
| ||||||||||||||||||||||||||
| ||||||||||||||||||||||||||
 Parish Results
| ||||||||||||||||||||||||||
| ||||||||||||||||||||||||||

| Elections in Louisiana |
|---|
 |
|
Presidential Elections
Presidential primaries U.S. Senate elections U.S. House elections Special elections |
|
State elections by year
Gubernatorial elections
Lieutenant gubernatorial elections Attorney General elections |
|
Mayoral elections
|
|
|
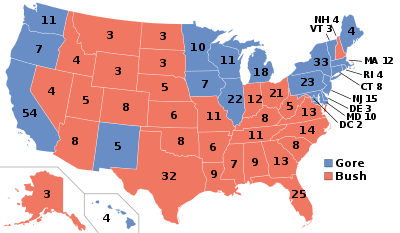
The 2000 United States presidential election in Louisiana took place on November 7, 2000, and was part of the 2000 United States presidential election. Voters chose 9 representatives, or electors to the Electoral College, who voted for president and vice president.
Louisiana was won by Governor George W. Bush, a dramatic swing from the statewide results in 1996 when Democrat President Bill Clinton carried the state with 52% of the vote and with a double-digit margin of victory. Bush was the first Republican to carry the state since 1988. Bush won most of the counties and congressional districts in the state. Bush dominated among the rural areas of the state. The only congressional district Gore won was the second district, which represents the very urban area of New Orleans. As of the 2016 presidential election, this is the last election in which St. Landry Parish, West Baton Rouge Parish, and Bienville Parish voted for the Democratic candidate.
Results
| United States presidential election in Louisiana, 2000 | |||||
|---|---|---|---|---|---|
| Party | Candidate | Votes | Percentage | Electoral votes | |
| Republican | George W. Bush | 927,871 | 52.6% | 9 | |
| Democratic | Al Gore | 792,344 | 44.9% | 0 | |
| Green Party | Ralph Nader | 20,473 | 1.2% | 0 | |
| Reform | Patrick Buchanan | 14,356 | 0.8% | 0 | |
| Constitution | Howard Phillips | 5,483 | 0.3% | 0 | |
| Libertarian | Harry Browne | 2,951 | 0.2% | 0 | |
| Socialist Workers | James Harris | 1,103 | 0.1% | 0 | |
| Natural Law | John Hagelin | 1,075 | 0.1% | 0 | |
| Totals | 1,765,656 | 100.00% | 9 | ||
| Voter turnout (Voting age/registered) | 51%/60% | ||||
By congressional district
Bush won 6 of 7 congressional districts.
| District | Bush | Gore | Representative |
|---|---|---|---|
| 1st | 67% | 31% | David Vitter |
| 2nd | 22% | 76% | William J. Jefferson |
| 3rd | 52% | 45% | Billy Tauzin |
| 4th | 55% | 43% | Jim McCrery |
| 5th | 57% | 40% | John Cooksey |
| 6th | 59% | 40% | Richard H. Baker |
| 7th | 55% | 42% | Chris John |
By parish
| Parish | Gore% | Gore# | Bush% | Bush# | Others% | Others# | Total |
|---|---|---|---|---|---|---|---|
| Acadia Parish | 38.26% | 8,892 | 59.45% | 13,814 | 02.29% | 532 | 23,238 |
| Allen Parish | 47.20% | 3,914 | 48.66% | 4,035 | 04.14% | 343 | 8,292 |
| Ascension Parish | 43.40% | 13,385 | 54.53% | 16,818 | 02.08% | 641 | 30,844 |
| Assumption Parish | 51.94% | 5,222 | 43.65% | 4,388 | 04.41% | 443 | 10,053 |
| Avoyelles Parish | 45.73% | 6,701 | 50.02% | 7,329 | 04.25% | 623 | 14,653 |
| Beauregard Parish | 32.43% | 3,958 | 64.42% | 7,862 | 03.15% | 385 | 12,205 |
| Bienville Parish | 48.72% | 3,413 | 46.66% | 3,269 | 04.62% | 324 | 7,006 |
| Bossier Parish | 33.23% | 11,933 | 64.66% | 23,224 | 02.11% | 758 | 35,915 |
| Caddo Parish | 49.70% | 47,530 | 48.94% | 46,807 | 01.36% | 1,302 | 95,639 |
| Calcasieu Parish | 46.06% | 33,919 | 51.72% | 38,086 | 02.21% | 1,631 | 73,636 |
| Caldwell Parish | 31.40% | 1,359 | 65.09% | 2,817 | 03.51% | 152 | 4,328 |
| Cameron Parish | 34.31% | 1,435 | 61.99% | 2,593 | 03.71% | 155 | 4,183 |
| Catahoula Parish | 36.05% | 1,718 | 61.11% | 2,912 | 02.83% | 135 | 4,765 |
| Claiborne Parish | 43.32% | 2,721 | 53.88% | 3,384 | 02.80% | 176 | 6,281 |
| Concordia Parish | 41.99% | 3,569 | 54.44% | 4,627 | 03.57% | 303 | 8,499 |
| De Soto Parish | 47.53% | 5,036 | 49.64% | 5,260 | 02.83% | 300 | 10,596 |
| East Baton Rouge Parish | 45.28% | 76,516 | 52.74% | 89,128 | 01.98% | 3,345 | 168,989 |
| East Carroll Parish | 57.81% | 1,876 | 39.45% | 1,280 | 02.74% | 89 | 3,245 |
| East Feliciana Parish | 47.78% | 3,870 | 50.02% | 4,051 | 02.20% | 178 | 8,099 |
| Evangeline Parish | 42.34% | 5,763 | 53.56% | 7,290 | 04.11% | 559 | 13,612 |
| Franklin Parish | 33.41% | 2,792 | 64.18% | 5,363 | 02.41% | 201 | 8,356 |
| Grant Parish | 29.75% | 2,099 | 67.81% | 4,784 | 02.44% | 172 | 7,055 |
| Iberia Parish | 39.18% | 11,762 | 57.42% | 17,236 | 03.40% | 1,022 | 30,020 |
| Iberville Parish | 57.61% | 8,355 | 38.43% | 5,573 | 03.96% | 575 | 14,503 |
| Jackson Parish | 36.34% | 2,582 | 61.17% | 4,347 | 02.49% | 177 | 7,106 |
| Jefferson Parish | 39.30% | 70,411 | 58.61% | 105,003 | 02.09% | 3,737 | 179,151 |
| Jefferson Davis Parish | 41.14% | 5,162 | 55.36% | 6,945 | 03.50% | 439 | 12,546 |
| Lafayette Parish | 34.73% | 27,190 | 61.94% | 48,491 | 03.34% | 2,612 | 78,293 |
| Lafourche Parish | 42.46% | 14,627 | 53.92% | 18,575 | 03.62% | 1,247 | 34,449 |
| LaSalle Parish | 22.87% | 1,397 | 74.72% | 4,564 | 02.41% | 147 | 6,108 |
| Lincoln Parish | 41.39% | 6,851 | 55.86% | 9,246 | 02.74% | 454 | 16,551 |
| Livingston Parish | 29.86% | 11,008 | 67.51% | 24,889 | 02.63% | 968 | 36,865 |
| Madison Parish | 52.48% | 2,489 | 44.85% | 2,127 | 02.68% | 127 | 4,743 |
| Morehouse Parish | 42.93% | 5,289 | 53.90% | 6,641 | 03.17% | 391 | 12,321 |
| Natchitoches Parish | 46.60% | 6,924 | 49.35% | 7,332 | 04.05% | 601 | 14,857 |
| Orleans Parish | 75.95% | 137,630 | 21.74% | 39,404 | 02.31% | 4,187 | 181,221 |
| Ouachita Parish | 36.86% | 21,457 | 60.31% | 35,107 | 02.83% | 1,647 | 58,211 |
| Plaquemines Parish | 40.48% | 4,425 | 57.65% | 6,302 | 01.87% | 204 | 10,931 |
| Pointe Coupee Parish | 53.67% | 5,813 | 43.48% | 4,710 | 02.85% | 309 | 10,832 |
| Rapides Parish | 38.55% | 18,898 | 58.81% | 28,831 | 02.64% | 1,295 | 49,024 |
| Red River Parish | 48.14% | 2,177 | 48.65% | 2,200 | 03.21% | 145 | 4,522 |
| Richland Parish | 38.68% | 3,282 | 57.69% | 4,895 | 03.63% | 308 | 8,485 |
| Sabine Parish | 32.11% | 2,846 | 64.93% | 5,754 | 02.96% | 262 | 8,862 |
| St. Bernard Parish | 40.82% | 11,682 | 56.79% | 16,255 | 02.39% | 684 | 28,621 |
| St. Charles Parish | 41.46% | 8,918 | 55.70% | 11,981 | 02.84% | 611 | 21,510 |
| St. Helena Parish | 58.22% | 3,059 | 37.40% | 1,965 | 04.38% | 230 | 5,254 |
| St. James Parish | 60.93% | 6,523 | 35.62% | 3,813 | 03.45% | 369 | 10,705 |
| St. John the Baptist Parish | 55.02% | 9,745 | 41.91% | 7,423 | 03.08% | 545 | 17,713 |
| St. Landry Parish | 52.90% | 18,067 | 45.24% | 15,449 | 01.86% | 635 | 34,151 |
| St. Martin Parish | 47.42% | 9,853 | 47.94% | 9,961 | 04.64% | 964 | 20,778 |
| St. Mary Parish | 45.17% | 9,851 | 51.93% | 11,325 | 02.91% | 634 | 21,810 |
| St. Tammany Parish | 27.13% | 22,722 | 70.69% | 59,193 | 02.18% | 1,822 | 83,737 |
| Tangipahoa Parish | 42.64% | 15,843 | 54.96% | 20,421 | 02.40% | 891 | 37,155 |
| Tensas Parish | 52.49% | 1,580 | 44.19% | 1,330 | 03.32% | 100 | 3,010 |
| Terrebonne Parish | 39.30% | 14,414 | 58.12% | 21,314 | 02.58% | 947 | 36,675 |
| Union Parish | 34.30% | 3,205 | 61.78% | 5,772 | 03.92% | 366 | 9,343 |
| Vermilion Parish | 39.15% | 8,704 | 56.20% | 12,495 | 04.66% | 1,036 | 22,235 |
| Vernon Parish | 33.67% | 4,655 | 63.60% | 8,794 | 02.73% | 378 | 13,827 |
| Washington Parish | 43.81% | 7,399 | 53.19% | 8,983 | 02.99% | 505 | 16,887 |
| Webster Parish | 42.11% | 7,197 | 55.12% | 9,420 | 02.77% | 473 | 17,090 |
| West Baton Rouge Parish | 49.74% | 5,058 | 48.42% | 4,924 | 01.84% | 187 | 10,169 |
| West Carroll Parish | 28.21% | 1,319 | 68.88% | 3,220 | 02.91% | 136 | 4,675 |
| West Feliciana Parish | 45.00% | 2,187 | 51.69% | 2,512 | 03.31% | 161 | 4,860 |
| Winn Parish | 34.07% | 2,167 | 63.32% | 4,028 | 02.61% | 166 | 6,361 |
Electors
Technically the voters of Louisiana cast their ballots for electors: representatives to the Electoral College. Louisiana is allocated 9 electors because it has 7 congressional districts and 2 senators. All candidates who appear on the ballot or qualify to receive write-in votes must submit a list of 9 electors, who pledge to vote for their candidate and his or her running mate. Whoever wins the majority of votes in the state is awarded all 9 electoral votes. Their chosen electors then vote for president and vice president. Although electors are pledged to their candidate and running mate, they are not obligated to vote for them. An elector who votes for someone other than his or her candidate is known as a faithless elector.
The electors of each state and the District of Columbia met on December 18, 2000[1] to cast their votes for president and vice president. The Electoral College itself never meets as one body. Instead the electors from each state and the District of Columbia met in their respective capitols.
The following were the members of the Electoral College from the state. All were pledged to and voted for George W. Bush and Dick Cheney:[2]
- Patricia Brister
- Donald Ensenat
- Heulette Fontenot Jr.
- Mike Foster
- Steve Jordan
- Elizabeth Levy
- Al Lippman
- Suzanne Haik Terrell
- Michael Woods Sr.