United States presidential election in Vermont, 2000
|
| |||||||||||||||||||||||||||||||||
| |||||||||||||||||||||||||||||||||
| |||||||||||||||||||||||||||||||||
 County Results
| |||||||||||||||||||||||||||||||||
| |||||||||||||||||||||||||||||||||


.svg.png)
The 2000 United States presidential election in Vermont took place on November 7, 2000, and was part of the 2000 United States presidential election. Voters chose 3 representatives, or electors to the Electoral College, who voted for president and vice president.
Vermont, in 2000, gave its 3 electoral votes to Vice President Al Gore who won the state by about 10 points over Texas Governor George W. Bush, while third-party candidate Ralph Nader took nearly 7% of the vote, his second-best showing in the country in terms of percentage of the vote after Alaska[1]. Gore's win in Vermont marked the third consecutive victory for Democrats in the Green Mountain State, and the last Republican candidate to win Vermont’s three electoral votes was Bush's father, George H.W. Bush, in 1988. This election marked the first time in the Republican Party’s history that a Republican nominee was elected without winning Vermont, and the first in the history of the Democratic Party that the Democrats carried the state with a majority of the popular vote twice in a row.
As of the 2016 presidential election, this is the last time a Republican presidential candidate received more than 40% of the vote in Vermont and where the margin of victory was in single digits. It has also been the only time since 1988 the Republicans have carried any county other than Essex – which has become a bellwether county analogous to the longtime status of neighbouring Coos County, New Hampshire.
As of the 2016 presidential election, this is the last presidential election in Vermont where a Republican candidate has been able to carry Caledonia, Orange, and Orleans counties.
Primaries
- Vermont Democratic primary, 2000
- Vermont Republican primary, 2000
Results
| United States presidential election in Vermont, 2000[2] | |||||
|---|---|---|---|---|---|
| Party | Candidate | Votes | Percentage | Electoral votes | |
| Democratic | Al Gore | 149,022 | 50.63% | 3 | |
| Republican | George W. Bush | 119,775 | 40.70% | 0 | |
| Green/Progressive | Ralph Nader | 20,374 | 6.92% | 0 | |
| Reform | Pat Buchanan | 2,192 | 0.74% | 0 | |
| Vermont Grassroots | Dennis "Denny" Lane | 1,044 | 0.35% | 0 | |
| Libertarian | Harry Browne | 784 | 0.27% | 0 | |
| Natural Law | John Hagelin | 219 | 0.07% | 0 | |
| Liberty Union Party | David McReynolds | 161 | 0.05% | 0 | |
| Constitution | Howard Phillips | 153 | 0.05% | 0 | |
| Socialist Workers | James Harris | 70 | 0.02% | 0 | |
| Write-in | 514 | 0.17% | — | ||
| Totals | 294,308 | 100.00% | 7 | ||
| Voter turnout | 64% | +6% | |||
Results Breakdown
By county
| County | Gore | Votes | Bush | Votes | Nader | Votes | Others | Votes |
|---|---|---|---|---|---|---|---|---|
| Addison | 51.3% | 8,936 | 39.9% | 6,953 | 6.9% | 1,207 | 1.9% | 331 |
| Bennington | 51.0% | 9,021 | 41.2% | 7,284 | 6.3% | 1,112 | 1.5% | 260 |
| Caledonia | 43.0% | 5,859 | 49.5% | 6,746 | 5.7% | 771 | 1.9% | 265 |
| Chittenden | 54.4% | 39,156 | 36.2% | 26,105 | 8.0% | 5,769 | 1.4% | 987 |
| Essex | 39.0% | 1,129 | 54.1% | 1,564 | 4.6% | 133 | 2.3% | 66 |
| Franklin | 49.6% | 9,514 | 43.7% | 8,395 | 4.3% | 823 | 2.4% | 462 |
| Grand Isle | 50.4% | 1,835 | 42.6% | 1,550 | 4.8% | 174 | 2.2% | 79 |
| Lamoille | 50.5% | 5,676 | 39.6% | 4,456 | 7.8% | 878 | 2.1% | 236 |
| Orange | 45.6% | 6,694 | 46.7% | 6,858 | 6.0% | 888 | 1.7% | 255 |
| Orleans | 45.1% | 5,472 | 47.8% | 5,799 | 4.6% | 564 | 2.4% | 297 |
| Rutland | 47.6% | 13,990 | 46.1% | 13,546 | 4.6% | 1,355 | 1.6% | 471 |
| Washington | 51.4% | 15,281 | 38.5% | 11,448 | 8.2% | 2,433 | 2.0% | 587 |
| Windham | 52.7% | 11,319 | 34.2% | 7,358 | 11.5% | 2,475 | 1.6% | 339 |
| Windsor | 51.9% | 15,140 | 40.2% | 11,713 | 6.1% | 1,792 | 1.7% | 502 |
References
- ↑ "2000 Presidential Election Statistics". Dave Leip’s Atlas of U.S. Presidential Elections. Retrieved 2018-03-05.
- ↑ "2000 Presidential General Election Results - Vermont" (PDF). Dave Leip's Atlas of U.S. Presidential Elections. 2001. Retrieved 2009-03-14. External link in
|publisher=(help)
See also
| Candidates | 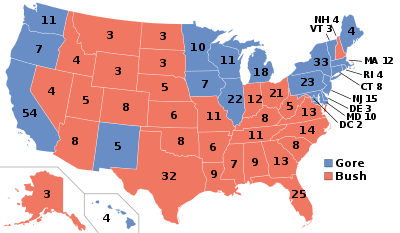 | |
|---|---|---|
| General articles | ||
| Local results |
| |
| Other 2000 elections | ||