United States presidential election in South Carolina, 2000
|
| ||||||||||||||||||||||||||
| ||||||||||||||||||||||||||
| ||||||||||||||||||||||||||
 County Results
| ||||||||||||||||||||||||||
| ||||||||||||||||||||||||||

The 2000 United States presidential election in South Carolina took place on November 7, 2000, and was part of the 2000 United States presidential election. Voters chose 8 representatives, or electors to the Electoral College, who voted for president and vice president.
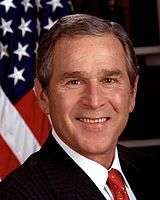
South Carolina was won by Governor George W. Bush by a 15.92% margin of victory. As of the 2016 presidential election, this is the last election in which Sumter County voted for the Republican.
Primaries
The Republican primary was held on February 19, 2000, with 37 delegates at stake.[1] South Carolina would prove to be a crucially important state for then-Gov. George W. Bush after losing to Sen. John McCain in New Hampshire by 18 points. Bush won the South Carolina primary by an 11.5% margin, and took the lion's share of the delegates at stake.
Candidates
- Governor George W. Bush of Texas
- Former Ambassador Alan Keyes of Maryland
- Senator John McCain of Arizona
Withdrawn
- Former Undersecretary of Education Gary Bauer of Kentucky
- Businessman Steve Forbes of New Jersey
- Senator Orrin Hatch of Utah
Results

| Candidate | Votes[2] | Percentage | Delegates |
|---|---|---|---|
| George W. Bush | 305,998 | 53.39% | 34 |
| John McCain | 239,964 | 41.87% | 3 |
| Alan Keyes | 25,996 | 4.54% | 0 |
| Other | 1,144 | 0.20% | 0 |
| Total | 573,101 | 100.00% | 37 |
Electors
The electors of each state and the District of Columbia met on December 18, 2000[3] to cast their votes for president and vice president. The Electoral College itself never meets as one body. Instead the electors from each state and the District of Columbia met in their respective capitols.
The following were the members of the Electoral College from the state. All were pledged to and voted for George Bush and Dick Cheney:[4]
- Cynthia F. Costa
- Danny R. Faulkner
- Thomas H. McLean
- William B. Prince
- Dan Richardson
- Douglas L. Wavle
- Cecil F. Windham Sr.
- Buddy Witherspoon
Results
| United States presidential election in South Carolina, 2000[5] | |||||
|---|---|---|---|---|---|
| Party | Candidate | Votes | Percentage | Electoral votes | |
| Republican | George W. Bush | 786,426 | 56.83% | 8 | |
| Democratic | Al Gore | 566,039 | 40.91% | 0 | |
| United Citizens | Ralph Nader | 20,279 | 1.47% | 0 | |
| Libertarian | Harry Browne | 4,888 | 0.35% | 0 | |
| Reform | Pat Buchanan | 3,520 | 0.25% | 0 | |
By county
| County | Gore% | Gore# | Bush% | Bush# | Others% | Others# | Total |
|---|---|---|---|---|---|---|---|
| Abbeville County | 44.97% | 3,766 | 53.14% | 4,450 | 1.89% | 158 | 8,374 |
| Aiken County | 32.31% | 16,409 | 65.38% | 33,203 | 2.30% | 1,170 | 50,782 |
| Allendale County | 70.00% | 2,338 | 28.95% | 967 | 1.05% | 35 | 3,340 |
| Anderson County | 34.59% | 19,606 | 63.21% | 35,827 | 2.20% | 1,248 | 56,681 |
| Bamberg County | 62.17% | 3,451 | 36.88% | 2,047 | 0.95% | 53 | 5,551 |
| Barnwell County | 44.24% | 3,661 | 54.63% | 4,521 | 1.14% | 94 | 8,276 |
| Beaufort County | 39.61% | 17,487 | 57.90% | 25,561 | 2.49% | 1,100 | 44,148 |
| Berkeley County | 40.88% | 17,707 | 57.24% | 24,796 | 1.88% | 813 | 43,316 |
| Calhoun County | 48.06% | 3,063 | 50.46% | 3,216 | 1.47% | 94 | 6,373 |
| Charleston County | 44.42% | 49,520 | 52.23% | 58,229 | 3.34% | 3,727 | 111,476 |
| Cherokee County | 37.60% | 6,138 | 60.65% | 9,900 | 1.75% | 285 | 16,323 |
| Chester County | 50.25% | 5,242 | 47.80% | 4,986 | 1.96% | 204 | 10,432 |
| Chesterfield County | 48.79% | 6,111 | 50.02% | 6,266 | 1.19% | 149 | 12,526 |
| Clarendon County | 53.14% | 5,999 | 45.93% | 5,186 | 0.93% | 105 | 11,290 |
| Colleton County | 48.16% | 6,449 | 50.54% | 6,767 | 1.30% | 174 | 13,390 |
| Darlington County | 46.90% | 10,253 | 51.64% | 11,290 | 1.46% | 320 | 21,863 |
| Dillon County | 54.84% | 4,930 | 44.22% | 3,975 | 0.95% | 85 | 8,990 |
| Dorchester County | 36.17% | 12,168 | 61.63% | 20,734 | 2.20% | 739 | 33,641 |
| Edgefield County | 44.71% | 3,950 | 53.88% | 4,760 | 1.40% | 124 | 8,834 |
| Fairfield County | 62.67% | 5,263 | 35.85% | 3,011 | 1.48% | 124 | 8,398 |
| Florence County | 41.41% | 17,157 | 57.14% | 23,678 | 1.45% | 602 | 41,437 |
| Georgetown County | 46.41% | 9,445 | 51.77% | 10,535 | 1.82% | 371 | 20,351 |
| Greenville County | 31.23% | 43,810 | 66.09% | 92,714 | 2.69% | 3,769 | 140,293 |
| Greenwood County | 39.02% | 8,139 | 58.45% | 12,193 | 2.53% | 528 | 20,860 |
| Hampton County | 63.10% | 4,896 | 36.06% | 2,798 | 0.84% | 65 | 7,759 |
| Horry County | 40.85% | 29,113 | 56.55% | 40,300 | 2.60% | 1,852 | 71,265 |
| Jasper County | 56.36% | 3,646 | 37.32% | 2,414 | 6.32% | 409 | 6,469 |
| Kershaw County | 37.75% | 7,428 | 60.53% | 11,911 | 1.72% | 338 | 19,677 |
| Lancaster County | 42.41% | 8,782 | 56.39% | 11,676 | 1.19% | 247 | 20,705 |
| Laurens County | 38.80% | 7,920 | 59.29% | 12,102 | 1.90% | 388 | 20,410 |
| Lee County | 58.70% | 3,899 | 40.27% | 2,675 | 1.02% | 68 | 6,642 |
| Lexington County | 27.48% | 22,830 | 69.93% | 58,095 | 2.60% | 2,156 | 83,081 |
| McCormick County | 51.79% | 1,896 | 46.54% | 1,704 | 1.67% | 61 | 3,661 |
| Marion County | 60.56% | 7,358 | 38.58% | 4,687 | 0.86% | 104 | 12,149 |
| Marlboro County | 64.19% | 5,060 | 34.24% | 2,699 | 1.57% | 124 | 7,883 |
| Newberry County | 35.79% | 4,428 | 60.56% | 7,492 | 3.65% | 452 | 12,372 |
| Oconee County | 32.11% | 7,571 | 65.17% | 15,364 | 2.71% | 640 | 23,575 |
| Orangeburg County | 60.49% | 19,802 | 38.67% | 12,657 | 0.84% | 275 | 32,734 |
| Pickens County | 25.81% | 8,927 | 71.37% | 24,681 | 2.82% | 974 | 34,582 |
| Richland County | 54.32% | 62,701 | 43.04% | 49,675 | 2.64% | 3,045 | 115,421 |
| Saluda County | 38.92% | 2,682 | 59.47% | 4,098 | 1.61% | 111 | 6,891 |
| Spartanburg County | 35.38% | 29,559 | 62.37% | 52,114 | 2.25% | 1,880 | 83,553 |
| Sumter County | 46.83% | 14,365 | 51.89% | 15,915 | 1.28% | 392 | 30,672 |
| Union County | 44.03% | 4,662 | 54.47% | 5,768 | 1.50% | 159 | 10,589 |
| Williamsburg County | 59.33% | 6,723 | 39.93% | 4,524 | 0.74% | 84 | 11,331 |
| York County | 35.42% | 19,251 | 62.14% | 33,776 | 2.44% | 1,324 | 54,351 |
References
- ↑ "2000 Republican Presidential Primary Results - South Carolina". Retrieved 2009-02-27.
- ↑ "FEC 2000 Republican Presidential Primary Results - South Carolina". Retrieved 2012-01-07.
- ↑ http://uselectionatlas.org/RESULTS/state.php?year=2000&fips=42&f=0&off=0&elect=0
- ↑ http://presidentelect.org/e2000.html
- ↑ http://uselectionatlas.org/RESULTS/index.html
See also
| Candidates | 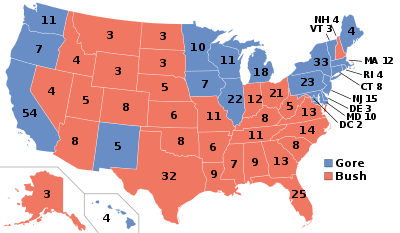 | |
|---|---|---|
| General articles | ||
| Local results |
| |
| Other 2000 elections | ||