Tippah County, Mississippi
| Tippah County, Mississippi | |
|---|---|
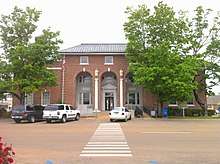 The Tippah County courthouse in Ripley | |
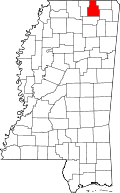 Location in the U.S. state of Mississippi | |
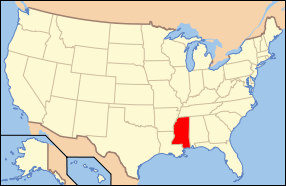 Mississippi's location in the U.S. | |
| Founded | 1836 |
| Seat | Ripley |
| Largest city | Ripley |
| Area | |
| • Total | 460 sq mi (1,191 km2) |
| • Land | 458 sq mi (1,186 km2) |
| • Water | 2.1 sq mi (5 km2), 0.5% |
| Population | |
| • (2010) | 22,232 |
| • Density | 49/sq mi (19/km2) |
| Congressional district | 1st |
| Time zone | Central: UTC−6/−5 |
| Website |
www |
Tippah County is a county located on the northern border of the U.S. state of Mississippi. As of the 2010 census, the population was 22,232.[1] Its county seat is Ripley.[2] The name "Tippah" is derived from a Chickasaw language word meaning "cut off." It was taken from the creek of the same name that flows across much of the original county from northeast to southwest before emptying into the Tallahatchie River. The creek probably was so named because it, and the ridges on either side, "cut off" the western part of the region from the eastern portion.
One of President Bill Clinton's great-grandfathers is buried here.[3]
Geography
According to the U.S. Census Bureau, the county has a total area of 460 square miles (1,200 km2), of which 458 square miles (1,190 km2) is land and 2.1 square miles (5.4 km2) (0.5%) is water.[4]
Major highways
Adjacent counties
- Hardeman County, Tennessee (north)
- Alcorn County (northeast)
- Prentiss County (southeast)
- Union County (south)
- Benton County (west)
National protected area
Demographics
| Historical population | |||
|---|---|---|---|
| Census | Pop. | %± | |
| 1840 | 9,444 | — | |
| 1850 | 20,741 | 119.6% | |
| 1860 | 22,550 | 8.7% | |
| 1870 | 20,727 | −8.1% | |
| 1880 | 12,867 | −37.9% | |
| 1890 | 12,951 | 0.7% | |
| 1900 | 12,983 | 0.2% | |
| 1910 | 14,631 | 12.7% | |
| 1920 | 15,419 | 5.4% | |
| 1930 | 18,658 | 21.0% | |
| 1940 | 19,680 | 5.5% | |
| 1950 | 17,522 | −11.0% | |
| 1960 | 15,093 | −13.9% | |
| 1970 | 15,852 | 5.0% | |
| 1980 | 18,739 | 18.2% | |
| 1990 | 19,523 | 4.2% | |
| 2000 | 20,826 | 6.7% | |
| 2010 | 22,232 | 6.8% | |
| Est. 2016 | 22,190 | [5] | −0.2% |
| U.S. Decennial Census[6] 1790-1960[7] 1900-1990[8] 1990-2000[9] 2010-2013[1] | |||
At the 2000 census,[10] there are 20,826 people, 8,108 households and 5,910 families residing in the county. The population density was 46 per square mile (18/km²). There were 8,868 housing units at an average density of 19 per square mile (7/km²). The racial makeup of the county was 81.85% White, 15.92% Black or African American, 0.20% Native American, 0.11% Asian, 0.01% Pacific Islander, 1.29% from other races, and 0.61% from two or more races. 2.08% of the population were Hispanic or Latino of any race.
As of 2000, there were 8,108 households of which 33.70% had children under the age of 18 living with them, 57.20% were married couples living together, 11.80% had a female householder with no husband present, and 27.10% were non-families. 24.90% of all households were made up of individuals and 11.40% had someone living alone who was 65 years of age or older. The average household size was 2.52 and the average family size was 3.00.
Age distribution was 25.00% under the age of 18, 10.10% from 18 to 24, 27.90% from 25 to 44, 22.50% from 45 to 64, and 14.50% who were 65 years of age or older. The median age was 36 years. For every 100 females there were 93.70 males. For every 100 females age 18 and over, there were 90.20 males.
The median household income was $29,300, and the median family income was $34,547. Males had a median income of $27,505 versus $20,446 for females. The per capita income for the county was $14,041 About 14.00% of families and 16.90% of the population were below the poverty line, including 19.00% of those under age 18 and 23.30% of those age 65 or over.
Communities
City
- Ripley (county seat)
Towns
Unincorporated communities
- Brownfield
- Chalybeate
- Tiplersville
- Lake Mohawk
- Dry Creek
- Cotton Plant
- Camp Hill
Politics
| Year | Republican | Democratic | Third parties |
|---|---|---|---|
| 2016 | 78.2% 7,240 | 19.9% 1,842 | 1.9% 178 |
| 2012 | 73.3% 6,717 | 25.3% 2,317 | 1.4% 130 |
| 2008 | 71.3% 6,937 | 27.0% 2,623 | 1.7% 165 |
| 2004 | 66.6% 6,174 | 32.5% 3,016 | 0.9% 85 |
| 2000 | 64.0% 5,381 | 34.6% 2,908 | 1.4% 114 |
| 1996 | 46.8% 3,249 | 43.1% 2,992 | 10.1% 701 |
| 1992 | 50.9% 4,444 | 39.8% 3,475 | 9.4% 820 |
| 1988 | 60.4% 4,593 | 38.9% 2,958 | 0.7% 52 |
| 1984 | 64.5% 4,706 | 35.2% 2,566 | 0.4% 29 |
| 1980 | 45.0% 3,338 | 52.2% 3,878 | 2.8% 207 |
| 1976 | 30.1% 1,887 | 67.9% 4,260 | 2.0% 127 |
| 1972 | 85.9% 3,937 | 12.4% 569 | 1.7% 79 |
| 1968 | 10.0% 589 | 11.3% 663 | 78.7% 4,627 |
| 1964 | 71.8% 2,482 | 28.2% 974 | |
| 1960 | 16.8% 486 | 67.1% 1,939 | 16.2% 467 |
| 1956 | 9.7% 287 | 86.9% 2,569 | 3.4% 99 |
| 1952 | 15.1% 511 | 84.9% 2,878 | |
| 1948 | 3.1% 66 | 19.8% 425 | 77.2% 1,661 |
| 1944 | 4.7% 126 | 95.3% 2,539 | |
| 1940 | 2.7% 63 | 97.3% 2,248 | |
| 1936 | 1.2% 19 | 98.8% 1,625 | |
| 1932 | 2.6% 52 | 97.2% 1,972 | 0.2% 4 |
| 1928 | 17.0% 298 | 83.0% 1,457 | |
| 1924 | 6.2% 96 | 90.9% 1,411 | 2.9% 45 |
| 1920 | 19.5% 237 | 78.7% 955 | 1.8% 22 |
| 1916 | 5.0% 82 | 94.3% 1,547 | 0.7% 11 |
| 1912 | 2.9% 34 | 89.9% 1,056 | 7.2% 85 |
See also
External links
- Tippah County - Official site.
References
- 1 2 "State & County QuickFacts". United States Census Bureau. Retrieved September 7, 2013.
- ↑ "Find a County". National Association of Counties. Retrieved 2011-06-07.
- ↑ Ashley Elkins, Editorial: "High-profile primary", September 2008
- ↑ "2010 Census Gazetteer Files". United States Census Bureau. August 22, 2012. Archived from the original on September 28, 2013. Retrieved November 8, 2014.
- ↑ "Population and Housing Unit Estimates". Retrieved June 9, 2017.
- ↑ "U.S. Decennial Census". United States Census Bureau. Retrieved November 8, 2014.
- ↑ "Historical Census Browser". University of Virginia Library. Retrieved November 8, 2014.
- ↑ "Population of Counties by Decennial Census: 1900 to 1990". United States Census Bureau. Retrieved November 8, 2014.
- ↑ "Census 2000 PHC-T-4. Ranking Tables for Counties: 1990 and 2000" (PDF). United States Census Bureau. Retrieved November 8, 2014.
- ↑ "American FactFinder". United States Census Bureau. Retrieved 2008-01-31.
- ↑ Leip, David. "Dave Leip's Atlas of U.S. Presidential Elections". uselectionatlas.org.
Places adjacent to Tippah County, Mississippi | ||||||||||
|---|---|---|---|---|---|---|---|---|---|---|
| ||||||||||
Municipalities and communities of Tippah County, Mississippi, United States | ||
|---|---|---|
| City | | |
| Towns | ||
| Unincorporated communities |
| |
.svg.png)