Tunica County, Mississippi
| Tunica County, Mississippi | |
|---|---|
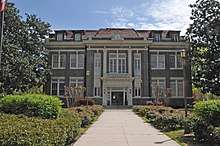 Tunica County Courthouse in Tunica | |
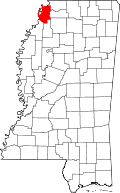 Location in the U.S. state of Mississippi | |
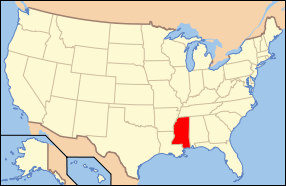 Mississippi's location in the U.S. | |
| Founded | 1836 |
| Named for | Tunica-Biloxi tribe |
| Seat | Tunica |
| Largest town | Tunica Resorts |
| Area | |
| • Total | 481 sq mi (1,246 km2) |
| • Land | 455 sq mi (1,178 km2) |
| • Water | 26 sq mi (67 km2), 5.4% |
| Population | |
| • (2010) | 10,778 |
| • Density | 24/sq mi (9/km2) |
| Congressional district | 2nd |
| Time zone | Central: UTC−6/−5 |
| Website |
tunicacountyms |
Tunica County is a county located in the U.S. state of Mississippi. As of the 2010 census, the population was 10,778.[1] Its county seat is Tunica.[2] The county is named for the Tunica Native Americans. Most migrated to central Louisiana during the colonial period.
Tunica County is part of the Memphis, TN–MS–AR Metropolitan Statistical Area. It is located in the Mississippi Delta region.
Since the late 20th century, it is known for Tunica Resorts (formerly Robinsonville), an unincorporated community that is the site of nine casino resorts. It is one of the top six destinations in the country in terms of gambling revenues.[3]
Geography
According to the U.S. Census Bureau, the county has a total area of 481 square miles (1,250 km2), of which 455 square miles (1,180 km2) is land and 26 square miles (67 km2) (5.4%) is water.[4]
Major highways
Adjacent counties
- Crittenden County, Arkansas (north)
- DeSoto County (northeast)
- Tate County (east)
- Panola County (southeast)
- Quitman County (south)
- Coahoma County (southwest)
- Phillips County, Arkansas (southwest)
- Lee County, Arkansas (west)
Demographics
| Historical population | |||
|---|---|---|---|
| Census | Pop. | %± | |
| 1840 | 821 | — | |
| 1850 | 1,314 | 60.0% | |
| 1860 | 4,366 | 232.3% | |
| 1870 | 5,358 | 22.7% | |
| 1880 | 8,461 | 57.9% | |
| 1890 | 12,158 | 43.7% | |
| 1900 | 16,479 | 35.5% | |
| 1910 | 18,646 | 13.2% | |
| 1920 | 20,386 | 9.3% | |
| 1930 | 21,233 | 4.2% | |
| 1940 | 22,610 | 6.5% | |
| 1950 | 21,664 | −4.2% | |
| 1960 | 16,826 | −22.3% | |
| 1970 | 11,854 | −29.5% | |
| 1980 | 9,652 | −18.6% | |
| 1990 | 8,164 | −15.4% | |
| 2000 | 9,227 | 13.0% | |
| 2010 | 10,778 | 16.8% | |
| Est. 2016 | 10,234 | [5] | −5.0% |
| U.S. Decennial Census[6] 1790-1960[7] 1900-1990[8] 1990-2000[9] 2010-2013[1] | |||
As of the 2010 United States Census, there were 10,778 people residing in the county. 73.5% were Black or African American, 23.7% White, 0.6% Asian, 0.1% Native American, 0.1% Pacific Islander, 1.2% of some other race and 0.9% of two or more races. 2.3% were Hispanic or Latino (of any race).
As of the census[10] of 2000, there were 9,227 people, 3,258 households, and 2,192 families residing in the county. The population density was 20 people per square mile (8/km²). There were 3,705 housing units at an average density of 8 per square mile (3/km²). The racial makeup of the county was 70.15% Black or African American, 27.54% White, 0.11% Native American, 0.42% Asian, 0.07% Pacific Islander, 0.96% from other races, and 0.75% from two or more races. 2.53% of the population were Hispanic or Latino of any race.
There were 3,258 households out of which 33.30% had children under the age of 18 living with them, 33.90% were married couples living together, 26.90% had a female householder with no husband present, and 32.70% were non-families. 26.90% of all households were made up of individuals and 9.90% had someone living alone who was 65 years of age or older. The average household size was 2.80 and the average family size was 3.44.
In the county, the population was spread out with 31.50% under the age of 18, 10.90% from 18 to 24, 27.40% from 25 to 44, 20.20% from 45 to 64, and 10.10% who were 65 years of age or older. The median age was 31 years. For every 100 females there were 91.10 males. For every 100 females age 18 and over, there were 85.90 males.
The median income for a household in the county was $23,270, and the median income for a family was $25,443. Males had a median income of $25,244 versus $18,104 for females. The per capita income for the county was $11,978. About 28.10% of families and 33.10% of the population were below the poverty line, including 43.40% of those under age 18 and 32.50% of those age 65 or over.
Education
- Public School Districts
- Private Schools
- Tunica Academy is located in an unincorporated area, near Tunica[11][12]
Communities
Town
- Tunica (county seat)
Census-designated places
- North Tunica
- Tunica Resorts (formerly known as Robinsonville)
- White Oak
Unincorporated communities
Ghost towns
Politics
| Year | Republican | Democratic | Third parties |
|---|---|---|---|
| 2016 | 23.9% 853 | 74.8% 2,667 | 1.3% 47 |
| 2012 | 20.2% 883 | 79.3% 3,475 | 0.6% 24 |
| 2008 | 23.5% 1,017 | 75.7% 3,279 | 0.8% 36 |
| 2004 | 30.4% 950 | 68.4% 2,140 | 1.3% 39 |
| 2000 | 33.5% 792 | 65.1% 1,539 | 1.5% 35 |
| 1996 | 29.5% 557 | 67.0% 1,263 | 3.5% 66 |
| 1992 | 30.9% 693 | 64.7% 1,451 | 4.4% 99 |
| 1988 | 36.9% 896 | 62.1% 1,510 | 1.0% 24 |
| 1984 | 39.6% 1,109 | 57.8% 1,621 | 2.6% 74 |
| 1980 | 29.8% 954 | 68.6% 2,198 | 1.7% 53 |
| 1976 | 34.5% 951 | 61.5% 1,695 | 4.0% 110 |
| 1972 | 62.2% 1,446 | 36.9% 858 | 0.9% 21 |
| 1968 | 17.7% 413 | 48.7% 1,133 | 33.6% 783 |
| 1964 | 90.5% 945 | 9.5% 99 | |
| 1960 | 37.2% 334 | 36.0% 323 | 26.8% 240 |
| 1956 | 23.9% 200 | 56.2% 470 | 19.9% 166 |
| 1952 | 42.0% 383 | 58.1% 530 | |
| 1948 | 1.6% 12 | 3.1% 23 | 95.3% 715 |
| 1944 | 4.6% 35 | 95.4% 721 | |
| 1940 | 1.6% 13 | 98.4% 795 | |
| 1936 | 0.7% 5 | 99.3% 701 | |
| 1932 | 1.4% 8 | 98.6% 573 | |
| 1928 | 3.8% 26 | 96.2% 654 | |
| 1924 | 2.6% 13 | 97.4% 495 | |
| 1920 | 0.8% 2 | 98.8% 256 | 0.4% 1 |
| 1916 | 100.0% 173 | ||
| 1912 | 0.5% 1 | 97.4% 188 | 2.1% 4 |
See also
References
| Wikimedia Commons has media related to Tunica County, Mississippi. |
- 1 2 "State & County QuickFacts". United States Census Bureau. Retrieved September 7, 2013.
- ↑ "Find a County". National Association of Counties. Retrieved 2011-06-07.
- ↑ "Tunica Resorts", American Gaming Association,
- ↑ "2010 Census Gazetteer Files". United States Census Bureau. August 22, 2012. Archived from the original on September 28, 2013. Retrieved November 8, 2014.
- ↑ "Population and Housing Unit Estimates". Retrieved June 9, 2017.
- ↑ "U.S. Decennial Census". United States Census Bureau. Retrieved November 8, 2014.
- ↑ "Historical Census Browser". University of Virginia Library. Retrieved November 8, 2014.
- ↑ "Population of Counties by Decennial Census: 1900 to 1990". United States Census Bureau. Retrieved November 8, 2014.
- ↑ "Census 2000 PHC-T-4. Ranking Tables for Counties: 1990 and 2000" (PDF). United States Census Bureau. Retrieved November 8, 2014.
- ↑ "American FactFinder". United States Census Bureau. Retrieved 2008-01-31.
- ↑ "Tunica town, Mississippi." U.S. Census Bureau. Retrieved on March 2, 2011.
- ↑ "Welcome to Tunica Academy." Tunica Academy. Retrieved on March 2, 2011. "584 Academy Drive — Tunica, MS 38676"
- ↑ Leip, David. "Dave Leip's Atlas of U.S. Presidential Elections". uselectionatlas.org. Retrieved 2018-03-06.
External links
Places adjacent to Tunica County, Mississippi | ||||||||||
|---|---|---|---|---|---|---|---|---|---|---|
| ||||||||||
Municipalities and communities of Tunica County, Mississippi, United States | ||
|---|---|---|
| Town | | |
| CDPs |
| |
| Other unincorporated communities | ||
| Ghost towns | ||
.svg.png)