Lowndes County, Mississippi
| Lowndes County, Mississippi | |
|---|---|
 | |
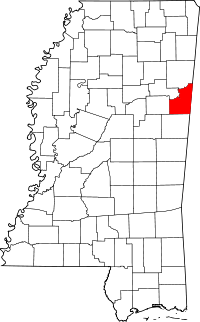 Location in the U.S. state of Mississippi | |
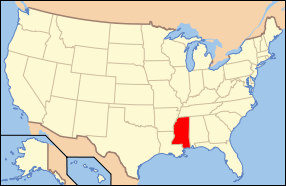 Mississippi's location in the U.S. | |
| Founded | 1830 |
| Named for | William Jones Lowndes |
| Seat | Columbus |
| Largest city | Columbus |
| Area | |
| • Total | 516 sq mi (1,336 km2) |
| • Land | 506 sq mi (1,311 km2) |
| • Water | 11 sq mi (28 km2), 2.1% |
| Population | |
| • (2017) | 67,892 |
| • Density | 118/sq mi (46/km2) |
| Congressional district | 1st |
| Time zone | Central: UTC−6/−5 |
| Website |
lowndescountyms |
Lowndes County is a county located on the eastern border of the U.S. state of Mississippi. As of the 2010 census, the population was 59,779.[1] Its county seat is Columbus.[2] The county is named for U.S. Congressman William Jones Lowndes.[3]
Lowndes County comprises the Columbus, MS Micropolitan Statistical Area.[4] Since the late 20th century, it has been designated as one of three counties in the Golden Triangle region of the state.
Geography
According to the U.S. Census Bureau, the county has a total area of 516 square miles (1,340 km2), of which 506 square miles (1,310 km2) is land and 11 square miles (28 km2) (2.1%) is water.[5]
History
This upland area was settled by European Americans who wanted to develop cotton plantations to produce what became the largest commodity crop in the state.
In the period from 1877 to 1950, Lowndes County had 19 documented lynchings of African Americans, third to Carroll and Leflore counties, which had 29 and 48, respectively.[6] This form of racial terrorism was at its height in the decades around the turn of the 20th century,[6] which followed the state's disenfranchisement of most blacks in 1890 through creating barriers to voter registration.
Major highways


Adjacent counties
- Noxubee County (south)
- Oktibbeha County (west)
- Clay County (northwest)
- Monroe County (north)
- Lamar County, Alabama (northeast)
- Pickens County, Alabama (southeast)
Demographics
| Historical population | |||
|---|---|---|---|
| Census | Pop. | %± | |
| 1830 | 3,173 | — | |
| 1840 | 14,513 | 357.4% | |
| 1850 | 19,544 | 34.7% | |
| 1860 | 23,625 | 20.9% | |
| 1870 | 30,502 | 29.1% | |
| 1880 | 28,244 | −7.4% | |
| 1890 | 27,047 | −4.2% | |
| 1900 | 29,095 | 7.6% | |
| 1910 | 30,703 | 5.5% | |
| 1920 | 27,632 | −10.0% | |
| 1930 | 29,987 | 8.5% | |
| 1940 | 35,245 | 17.5% | |
| 1950 | 37,852 | 7.4% | |
| 1960 | 46,639 | 23.2% | |
| 1970 | 49,700 | 6.6% | |
| 1980 | 57,304 | 15.3% | |
| 1990 | 59,308 | 3.5% | |
| 2000 | 61,586 | 3.8% | |
| 2010 | 59,779 | −2.9% | |
| Est. 2016 | 59,602 | [7] | −0.3% |
| U.S. Decennial Census[8] 1790-1960[9] 1900-1990[10] 1990-2000[11] 2010-2013[1] | |||
As of the 2010 United States Census, there were 59,779 people residing in the county. 54.0% were White, 43.5% Black or African American, 0.7% Asian, 0.2% Native American, 0.1% Pacific Islander, 0.6% of some other race and 1.1% of two or more races. 1.5% were Hispanic or Latino (of any race).
As of the census[12] of 2000, there were 61,586 people, 22,849 households, and 16,405 families residing in the county. The population density was 123 people per square mile (47/km²). There were 25,104 housing units at an average density of 50 per square mile (19/km²). The racial makeup of the county was 56.47% White, 41.56% Black or African American, 0.17% Native American, 0.54% Asian, 0.03% Pacific Islander, 0.39% from other races, and 0.85% from two or more races. 1.11% of the population were Hispanic or Latino of any race.
There were 22,849 households out of which 36.50% had children under the age of 18 living with them, 49.20% were married couples living together, 18.70% had a female householder with no husband present, and 28.20% were non-families. 24.60% of all households were made up of individuals and 8.90% had someone living alone who was 65 years of age or older. The average household size was 2.61 and the average family size was 3.13.
In the county, the population was spread out with 28.60% under the age of 18, 10.60% from 18 to 24, 29.20% from 25 to 44, 20.40% from 45 to 64, and 11.20% who were 65 years of age or older. The median age was 33 years. For every 100 females there were 89.90 males. For every 100 females age 18 and over, there were 84.20 males.
The median income for a household in the county was $32,123, and the median income for a family was $38,248. Males had a median income of $31,792 versus $20,640 for females. The per capita income for the county was $16,514. About 18.00% of families and 21.30% of the population were below the poverty line, including 31.80% of those under age 18 and 16.80% of those age 65 or over.
Education
Primary and secondary schools
Portions of Lowndes County are served by the Columbus Municipal School District, Lowndes County School District, and the Mississippi Association of Independent Schools - Lowndes County Division.
The Columbus Municipal School District includes:
- Columbus High School
- Columbus Middle School
- McKellar Technology Center
- Joe Cook Elementary Fine Arts Magnet School
- Fairview Elementary Aerospace and Science Magnet School
- Franklin Academy Elementary Medical Sciences and Wellness Magnet School
- Sale Elementary International Studies Magnet School
- Stokes-Beard Elementary Communication and Technology Magnet School
- Columbus Alternative School
The Lowndes County School District has three areas, each with an elementary school, a middle school, and a high school
- Caledonia Schools
- New Hope Schools
- West Lowndes Schools
The Mississippi Association of Independent Schools - Lowndes County Division has provided five private and parochial schools for Lowndes County
- Heritage Academy High School
- Heritage Academy Elementary School
- Columbus Christian Academy
- Victory Christian Academy
- Annunciation Catholic School
Colleges and universities
Lowndes County is home of Mississippi University for Women located in Columbus. Lowndes County is within the service area of the East Mississippi Community College system.[13] The Golden Triangle Campus is located in Mayhew, an unincorporated area in Lowndes County. The system also offers classes at the Columbus Air Force Base Extension in Columbus.[14]
Communities
City
- Columbus (county seat)
Town
Census-designated places
Unincorporated communities
Ghost towns
Politics
| Year | Republican | Democratic | Third parties |
|---|---|---|---|
| 2016 | 51.7% 13,271 | 46.0% 11,819 | 2.4% 605 |
| 2012 | 49.8% 13,518 | 49.3% 13,388 | 0.9% 252 |
| 2008 | 51.0% 13,994 | 48.1% 13,209 | 1.0% 262 |
| 2004 | 56.4% 13,690 | 42.9% 10,408 | 0.7% 172 |
| 2000 | 59.3% 11,404 | 39.2% 7,537 | 1.5% 289 |
| 1996 | 56.4% 9,169 | 38.3% 6,220 | 5.3% 869 |
| 1992 | 55.8% 10,509 | 34.8% 6,552 | 9.4% 1,774 |
| 1988 | 65.0% 11,258 | 34.6% 5,993 | 0.5% 80 |
| 1984 | 66.3% 12,049 | 33.4% 6,078 | 0.3% 50 |
| 1980 | 61.0% 9,973 | 37.8% 6,187 | 1.2% 195 |
| 1976 | 54.4% 8,003 | 42.1% 6,181 | 3.5% 516 |
| 1972 | 78.7% 10,098 | 18.7% 2,398 | 2.6% 335 |
| 1968 | 17.9% 1,968 | 20.2% 2,229 | 61.9% 6,829 |
| 1964 | 92.0% 6,135 | 8.0% 533 | |
| 1960 | 43.0% 2,010 | 26.5% 1,240 | 30.6% 1,430 |
| 1956 | 29.2% 1,205 | 55.9% 2,308 | 14.9% 613 |
| 1952 | 62.3% 2,670 | 37.7% 1,618 | |
| 1948 | 2.3% 66 | 4.0% 116 | 93.8% 2,755 |
| 1944 | 14.0% 360 | 86.0% 2,216 | |
| 1940 | 6.1% 147 | 93.8% 2,268 | 0.1% 3 |
| 1936 | 2.3% 56 | 97.2% 2,328 | 0.4% 10 |
| 1932 | 2.1% 50 | 97.5% 2,305 | 0.4% 9 |
| 1928 | 8.0% 185 | 92.0% 2,136 | |
| 1924 | 3.6% 62 | 96.4% 1,655 | |
| 1920 | 5.2% 51 | 93.9% 928 | 0.9% 9 |
| 1916 | 2.7% 29 | 96.5% 1,028 | 0.8% 8 |
| 1912 | 1.3% 12 | 95.8% 872 | 2.9% 26 |
See also
References
- 1 2 "State & County QuickFacts". United States Census Bureau. Archived from the original on July 14, 2011. Retrieved September 4, 2013.
- ↑ "Find a County". National Association of Counties. Retrieved 2011-06-07.
- ↑ Gannett, Henry (1905). The Origin of Certain Place Names in the United States. U.S. Government Printing Office. p. 191.
- ↑ "OMB Bulletin No. 13-01: Revised Delineations of Metropolitan Statistical Areas, Micropolitan Statistical Areas, and Combined Statistical Areas, and Guidance on Uses of the Delineations of These Areas" (PDF). United States Office of Management and Budget. February 28, 2013. Archived from the original (PDF) on March 19, 2013. Retrieved April 3, 2013.
- ↑ "2010 Census Gazetteer Files". United States Census Bureau. August 22, 2012. Archived from the original on September 28, 2013. Retrieved November 6, 2014.
- 1 2 Lynching in America, 3rd edition, Supplement by County, p. 6
- ↑ "Population and Housing Unit Estimates". Retrieved June 9, 2017.
- ↑ "U.S. Decennial Census". United States Census Bureau. Retrieved November 6, 2014.
- ↑ "Historical Census Browser". University of Virginia Library. Retrieved November 6, 2014.
- ↑ "Population of Counties by Decennial Census: 1900 to 1990". United States Census Bureau. Retrieved November 6, 2014.
- ↑ "Census 2000 PHC-T-4. Ranking Tables for Counties: 1990 and 2000" (PDF). United States Census Bureau. Retrieved November 6, 2014.
- ↑ "American FactFinder". United States Census Bureau. Retrieved 2008-01-31.
- ↑ "CATALOG 2007-2009 Archived 2010-12-18 at the Wayback Machine.." East Mississippi Community College. 3 (3/147). Retrieved on March 1, 2011.
- ↑ "CATALOG 2007-2009 Archived 2010-12-18 at the Wayback Machine.." East Mississippi Community College. 10 (10/147). Retrieved on March 1, 2011.
- ↑ Leip, David. "Dave Leip's Atlas of U.S. Presidential Elections". uselectionatlas.org. Retrieved 2018-03-04.
Places adjacent to Lowndes County, Mississippi | ||||||||||
|---|---|---|---|---|---|---|---|---|---|---|
| ||||||||||
Municipalities and communities of Lowndes County, Mississippi, United States | ||
|---|---|---|
| City | | |
| Towns | ||
| CDPs | ||
| Unincorporated communities | ||
| Ghost towns | ||
.svg.png)