United States presidential election in Mississippi, 2008
|
| ||||||||||||||||||||||||||
| ||||||||||||||||||||||||||
| ||||||||||||||||||||||||||
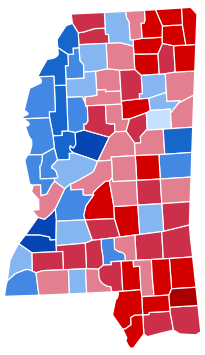 County Results
| ||||||||||||||||||||||||||
| ||||||||||||||||||||||||||
.jpg)
| Elections in Mississippi |
|---|
.svg.png) |
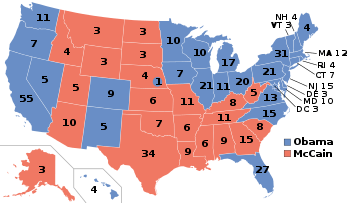
The 2008 United States presidential election in Mississippi took place on November 4, 2008, and was part of the 2008 United States presidential election. Voters chose 6 representatives, or electors to the Electoral College, who voted for president and vice president.
Mississippi was won by Republican nominee John McCain with a 13.2% margin of victory. Prior to the election, all 17 news organizations considered this a state McCain would win, or otherwise considered as a safe red state. Although the state has the largest African American percentage in the country, Mississippi remains a safe red state at the presidential level, having voted Republican every election year since 1980. While there was comparably high African American turnout compared to previous elections in Mississippi, it was not enough to overcome the state's strong Republican leanings.
Primaries
Campaign
Predictions
There were 17 news organizations who made state-by-state predictions of the election. Here are their last predictions before election day:
- D.C. Political Report: Republican[1]
- Cook Political Report: Solid Republican[2]
- Takeaway: Solid McCain[3]
- Election Projection: Solid McCain[4]
- Electoral-vote.com: Strong Republican[5]
- Washington Post: Solid McCain[6]
- Politico: Solid McCain[7]
- Real Clear Politics: Solid McCain[8]
- FiveThirtyEight.com: Solid McCain[6]
- CQ Politics: Safe Republican[9]
- New York Times: Solid Republican[10]
- CNN: Safe Republican[11]
- NPR: Solid McCain[6]
- MSNBC: Solid McCain[6]
- Fox News: Republican[12]
- Associated Press: Republican[13]
- Rasmussen Reports: Safe Republican[14]
Polling
McCain won every single pre-election poll, each with at least 50% of the vote with the exception of the one of them. The final 3 polls average gave the Republican a lead of 51% to 39%.[15]
Fundraising
John McCain raised a total of $1,386,749 in the state. Barack Obama raised $768,981.[16]
Advertising and visits
Obama spent $238,401. McCain and his interest groups spent $139,999.[17] The McCain ticket visited three times. Obama's ticket visited the state once.[18]
Analysis
Mississippi is one of the most racially polarized states in presidential elections. African Americans uniformly vote Democratic while Caucasians vote Republican nearly as uniformly. In 2004, 14% of Caucasians voted for John Kerry and 10% of African Americans voted for Bush, according to exit polling.[19]
White Democrats began splitting their tickets in national elections as early as the 1940s when the national party became more friendly to the Civil Rights Movement, culminating when Barry Goldwater carried the state with a staggering 87 percent of the vote in 1964. The Republican trend accelerated in the late 1970s with the rise of the religious right. The last Democratic presidential nominee to win Mississippi was Jimmy Carter in 1976, even then, he only won it by 1.9 points. Due to its status as a safe red state, little campaigning took place in Mississippi by either of the two major party candidates. Indeed, the state was last seriously contested in 1980.
In 2008, Barack Obama was able to improve on Kerry's performance by six percent, mainly due to the higher African American turnout. Obama's main support was in the Black Belt, the western delta counties next to the Mississippi River. In contrast, McCain's margins came from the regions bordering the Gulf Coast, the northeast Appalachian area and the Jackson and Memphis suburbs. Voting became even more polarized: nine in ten whites voted Republican, and nearly all blacks voted Democratic in Mississippi, according to exit polls.[19] As expected, McCain carried the Magnolia State by a comfortable 13.18-point margin over Obama. McCain's margin of victory, however, was less than that of George W. Bush's 19.69-point margin of victory over John Kerry in 2004.
Mississippi was also the only state to list the official candidates of the Reform Party on their ballot.[20]
At the same time, incumbent Republican U.S. Senator Thad Cochran was reelected with 61.44% of the vote over Democrat Erik Fleming who received 38.56%. Appointed U.S. Senator Roger Wicker stood for election as well in 2008 against former Democratic Governor Ronnie Musgrove. The race was expected to be much closer, but the Republicans ran ads accusing Musgrove of supporting gay rights, not a popular position in this strongly socially conservative state. Wicker defeated Musgrove by almost 10 points, 54.96%-45.04%.
Results
| United States presidential election in Mississippi, 2008[21] | ||||||
|---|---|---|---|---|---|---|
| Party | Candidate | Running mate | Votes | Percentage | Electoral votes | |
| Republican | John McCain | Sarah Palin | 724,597 | 56.17% | 6 | |
| Democratic | Barack Obama | Joe Biden | 554,662 | 43.00% | 0 | |
| Independent | Ralph Nader | Matt Gonzalez | 4,011 | 0.31% | 0 | |
| Constitution | Chuck Baldwin | Darrell Castle | 2,551 | 0.20% | 0 | |
| Libertarian | Bob Barr | Wayne Allyn Root | 2,529 | 0.20% | 0 | |
| Green | Cynthia McKinney | Rosa Clemente | 1,034 | 0.08% | 0 | |
| Reform | Ted Weill | Frank McEnulty | 481 | 0.04% | 0 | |
| Write-ins | Write-ins | 74 | 0.01% | 0 | ||
| Totals | 1,289,939 | 100.00% | 6 | |||
| Voter turnout (Voting age population) | 61.2% | |||||
Results breakdown
By county
| County | Obama% | Obama# | McCain% | McCain# |
|---|---|---|---|---|
| Adams | 59.01% | 7,630 | 40.99% | 5,300 |
| Alcorn | 27.51% | 3,701 | 72.49% | 9,752 |
| Amite | 44.07% | 3,320 | 55.93% | 4,214 |
| Attala | 41.79% | 3,739 | 58.21% | 5,209 |
| Benton | 48.85% | 2,224 | 51.15% | 2,329 |
| Bolivar | 67.85% | 9,471 | 32.15% | 4,487 |
| Calhoun | 35.53% | 2,242 | 64.47% | 4,068 |
| Carroll | 34.28% | 2,027 | 65.72% | 3,886 |
| Chickasaw | 50.74% | 4,053 | 49.26% | 3,934 |
| Choctaw | 35.73% | 1,459 | 64.27% | 2,624 |
| Claiborne | 84.93% | 3,561 | 15.07% | 632 |
| Clarke | 36.82% | 2,727 | 63.18% | 4,679 |
| Clay | 59.28% | 6,424 | 40.72% | 4,412 |
| Coahoma | 73.52% | 6,947 | 26.48% | 2,502 |
| Copiah | 53.34% | 7,640 | 46.66% | 6,683 |
| Covington | 41.01% | 3,826 | 58.99% | 5,503 |
| DeSoto | 30.69% | 19,265 | 69.31% | 43,510 |
| Forrest | 43.18% | 11,622 | 56.82% | 15,296 |
| Franklin | 37.29% | 1,722 | 62.71% | 2,896 |
| George | 16.55% | 1,398 | 83.45% | 7,050 |
| Greene | 23.81% | 1,362 | 76.19% | 4,358 |
| Grenada | 44.56% | 4,995 | 55.44% | 6,215 |
| Hancock | 21.57% | 3,195 | 78.43% | 11,614 |
| Harrison | 36.90% | 22,175 | 63.10% | 37,927 |
| Hinds | 70.21% | 68,794 | 29.79% | 29,187 |
| Holmes | 82.20% | 6,945 | 17.80% | 1,504 |
| Humphreys | 71.90% | 3,180 | 28.10% | 1,243 |
| Issaquena | 61.89% | 523 | 38.11% | 322 |
| Itawamba | 21.12% | 1,938 | 78.88% | 7,240 |
| Jackson | 32.03% | 15,534 | 67.97% | 32,959 |
| Jasper | 55.01% | 4,476 | 44.99% | 3,660 |
| Jefferson Davis | 60.97% | 3,924 | 39.03% | 2,512 |
| Jefferson | 87.98% | 3,295 | 12.02% | 450 |
| Jones | 30.17% | 8,089 | 69.83% | 18,726 |
| Kemper | 62.93% | 2,876 | 37.07% | 1,694 |
| Lafayette | 43.76% | 7,997 | 56.24% | 10,278 |
| Lamar | 21.67% | 4,694 | 78.33% | 16,969 |
| Lauderdale | 40.25% | 13,048 | 59.75% | 19,368 |
| Lawrence | 36.79% | 2,513 | 63.21% | 4,318 |
| Leake | 44.22% | 3,575 | 55.78% | 4,509 |
| Lee | 34.44% | 11,769 | 65.56% | 22,403 |
| Leflore | 68.47% | 8,914 | 31.53% | 4,105 |
| Lincoln | 33.80% | 5,505 | 66.20% | 10,781 |
| Lowndes | 48.48% | 13,110 | 51.52% | 13,934 |
| Madison | 42.12% | 18,034 | 57.88% | 24,781 |
| Marion | 33.87% | 3,764 | 66.13% | 7,350 |
| Marshall | 59.01% | 9,573 | 40.99% | 6,650 |
| Monroe | 41.25% | 7,137 | 58.75% | 10,165 |
| Montgomery | 45.96% | 2,244 | 54.04% | 2,638 |
| Neshoba | 26.40% | 2,584 | 73.60% | 7,205 |
| Newton | 32.58% | 3,063 | 67.42% | 6,338 |
| Noxubee | 76.73% | 4,970 | 23.27% | 1,507 |
| Oktibbeha | 50.02% | 9,326 | 49.98% | 9,320 |
| Panola | 52.69% | 8,370 | 47.31% | 7,515 |
| Pearl River | 18.74% | 3,727 | 81.26% | 16,156 |
| Perry | 27.35% | 1,521 | 72.65% | 4,040 |
| Pike | 51.68% | 7,958 | 48.32% | 7,441 |
| Pontotoc | 23.41% | 2,951 | 76.59% | 9,656 |
| Prentiss | 28.16% | 3,020 | 71.84% | 7,703 |
| Quitman | 67.71% | 2,797 | 32.29% | 1,334 |
| Rankin | 23.00% | 14,235 | 77.00% | 47,645 |
| Scott | 43.15% | 4,709 | 56.85% | 6,205 |
| Sharkey | 68.72% | 1,722 | 31.28% | 784 |
| Simpson | 39.74% | 4,393 | 60.26% | 6,660 |
| Smith | 24.16% | 1,821 | 75.84% | 5,715 |
| Stone | 27.25% | 1,746 | 72.75% | 4,661 |
| Sunflower | 71.17% | 7,158 | 28.83% | 2,900 |
| Tallahatchie | 59.96% | 3,646 | 40.04% | 2,435 |
| Tate | 39.32% | 4,951 | 60.68% | 7,639 |
| Tippah | 26.97% | 2,514 | 73.03% | 6,809 |
| Tishomingo | 23.86% | 1,941 | 76.14% | 6,195 |
| Tunica | 77.15% | 2,917 | 22.85% | 864 |
| Union | 24.73% | 2,727 | 75.27% | 8,302 |
| Walthall | 44.63% | 3,421 | 55.37% | 4,244 |
| Warren | 48.84% | 9,502 | 51.16% | 9,953 |
| Washington | 67.25% | 12,884 | 32.75% | 6,274 |
| Wayne | 38.93% | 3,860 | 61.07% | 6,056 |
| Webster | 24.68% | 1,321 | 75.32% | 4,032 |
| Wilkinson | 69.21% | 3,498 | 30.79% | 1,556 |
| Winston | 45.70% | 4,606 | 54.30% | 5,473 |
| Yalobusha | 46.27% | 3,104 | 53.73% | 3,604 |
| Yazoo | 57.57% | 5,725 | 42.43% | 4,219 |
By congressional district
John McCain carried three of the state’s four congressional districts, including two districts held by Democrats.
| District | McCain | Obama | Representative |
|---|---|---|---|
| 1st | 61.28% | 37.74% | Roger Wicker (110th Congress) |
| Travis Childers (111th Congress) | |||
| 2nd | 33.57% | 65.86% | Bennie G. Thompson |
| 3rd | 61.08% | 38.17% | Chip Pickering (110th Congress) |
| Gregg Harper (111th Congress) | |||
| 4th | 67.27% | 31.76% | Gene Taylor |
Electors
Technically the voters of Mississippi cast their ballots for electors: representatives to the Electoral College. Mississippi is allocated 6 electors because it has 4 congressional districts and 2 senators. All candidates who appear on the ballot or qualify to receive write-in votes must submit a list of 6 electors, who pledge to vote for their candidate and his or her running mate. Whoever wins the majority of votes in the state is awarded all 6 electoral votes. Their chosen electors then vote for president and vice president. Although electors are pledged to their candidate and running mate, they are not obligated to vote for them.[22] An elector who votes for someone other than his or her candidate is known as a faithless elector.
The electors of each state and the District of Columbia met on December 15, 2008, to cast their votes for president and vice president. The Electoral College itself never meets as one body. Instead the electors from each state and the District of Columbia met in their respective capitols.
The following were the members of the Electoral College from the state. All 6 were pledged to John McCain and Sarah Palin:[23]
- Jim Barksdale
- Barry Bridgforth
- Fred Carl
- Bobby Chain
- Charles Doty
- Victor Mavar
References
- ↑ D.C.'s Political Report: The complete source for campaign summaries
- ↑ Presidential | The Cook Political Report Archived May 5, 2015, at the Wayback Machine.
- ↑ Vote 2008 - The Takeaway - Track the Electoral College vote predictions Archived April 22, 2009, at the Wayback Machine.
- ↑ Election Projection: 2008 Elections - Polls, Projections, Results
- ↑ Electoral-vote.com: President, Senate, House Updated Daily
- 1 2 3 4 Based on Takeaway
- ↑ POLITICO's 2008 Swing State Map - POLITICO.com
- ↑ RealClearPolitics - Electoral Map
- ↑ CQ Politics | CQ Presidential Election Maps, 2008 Archived October 29, 2008, at the Wayback Machine.
- ↑ "Electoral College Map". The New York Times. Retrieved 2010-05-26.
- ↑ "October – 2008 – CNN Political Ticker - CNN.com Blogs". CNN. Retrieved 2010-05-26.
- ↑ "Winning the Electoral College". Fox News. 2010-04-27.
- ↑ roadto270
- ↑ Election 2008: Electoral College Update - Rasmussen Reports™
- ↑ Election 2008 Polls - Dave Leip's Atlas of U.S. Presidential Elections
- ↑ Presidential Campaign Finance
- ↑ "Map: Campaign Ad Spending - Election Center 2008 from CNN.com". CNN. Retrieved 2010-05-26.
- ↑ "Map: Campaign Candidate Visits - Election Center 2008 from CNN.com". CNN. Retrieved 2010-05-26.
- 1 2 "CNN Election 2004". CNN. Retrieved 2009-04-06.
- ↑ http://reformpa.web.aplus.net/news.htm%5Bpermanent+dead+link%5D
- ↑ "Atlas of U.S. Presidential Elections". Retrieved 2013-01-13.
- ↑ "Electoral College". California Secretary of State. Archived from the original on October 30, 2008. Retrieved 2008-11-01.
- ↑ http://www.sos.state.ms.us/elections/2008/PDF/PRESIDENTIAL%20ELECTORS2.pdf