Pontotoc County, Mississippi
| Pontotoc County, Mississippi | |
|---|---|
| County | |
| County of Pontotoc | |
 Pontotoc County Courthouse in Pontotoc | |
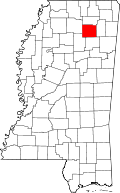 Location in the U.S. state of Mississippi | |
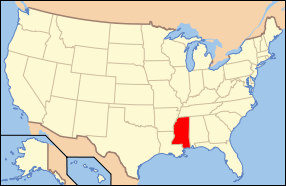 Mississippi's location in the U.S. | |
| Founded | 1836 |
| Seat | Pontotoc |
| Largest city | Pontotoc |
| Area | |
| • Total | 501 sq mi (1,298 km2) |
| • Land | 498 sq mi (1,290 km2) |
| • Water | 3.3 sq mi (9 km2), 0.7% |
| Population | |
| • (2010) | 29,957 |
| • Density | 60/sq mi (20/km2) |
| Congressional district | 1st |
| Time zone | Central: UTC−6/−5 |
| Website |
pontotoccoms |
Pontotoc County is a county located in the U.S. state of Mississippi. As of the 2010 census, the population was 29,957.[1] Its county seat is Pontotoc.[2] It was created on February 9, 1836 from lands ceded to the United States under the Chickasaw Cession. Pontotoc is a Chickasaw word meaning "land of hanging grapes". The original Natchez Trace and the current-day Natchez Trace Parkway both pass through the southeast corner of Pontotoc County.
Pontotoc County is part of the Tupelo, MS Micropolitan Statistical Area.
Geography
According to the U.S. Census Bureau, the county has a total area of 501 square miles (1,300 km2), of which 498 square miles (1,290 km2) is land and 3.3 square miles (8.5 km2) (0.7%) is water.[3]
Major highways


- Natchez Trace Parkway
Adjacent counties
- Union County (north)
- Lee County (east)
- Chickasaw County (south)
- Calhoun County (southwest)
- Lafayette County (west)
National protected area
- Natchez Trace Parkway (part)
- Tombigbee National Forest (part)
Demographics
| Historical population | |||
|---|---|---|---|
| Census | Pop. | %± | |
| 1840 | 4,491 | — | |
| 1850 | 17,112 | 281.0% | |
| 1860 | 22,113 | 29.2% | |
| 1870 | 12,525 | −43.4% | |
| 1880 | 13,858 | 10.6% | |
| 1890 | 14,940 | 7.8% | |
| 1900 | 18,274 | 22.3% | |
| 1910 | 19,688 | 7.7% | |
| 1920 | 19,962 | 1.4% | |
| 1930 | 22,034 | 10.4% | |
| 1940 | 22,904 | 3.9% | |
| 1950 | 19,994 | −12.7% | |
| 1960 | 17,232 | −13.8% | |
| 1970 | 17,363 | 0.8% | |
| 1980 | 20,918 | 20.5% | |
| 1990 | 22,237 | 6.3% | |
| 2000 | 26,726 | 20.2% | |
| 2010 | 29,957 | 12.1% | |
| Est. 2016 | 31,550 | [4] | 5.3% |
| U.S. Decennial Census[5] 1790-1960[6] 1900-1990[7] 1990-2000[8] 2010-2013[1] | |||
As of the census[9] of 2000, there were 26,726 people, 10,097 households, and 7,562 families residing in the county. The population density was 54 people per square mile (21/km²). There were 10,816 housing units at an average density of 22 per square mile (8/km²). The racial makeup of the county was 84.40% White, 13.98% Black or African American, 0.27% Native American, 0.10% Asian, 0.01% Pacific Islander, 0.71% from other races, and 0.54% from two or more races. 1.80% of the population were Hispanic or Latino of any race.
According to the census[9] of 2000, the largest ancestry groups in Potontoc County were English 61.92%, Scots-Irish 15.1%, African 13.98% and Scottish 3%
There were 10,097 households out of which 37.10% had children under the age of 18 living with them, 59.20% were married couples living together, 11.90% had a female householder with no husband present, and 25.10% were non-families. 22.70% of all households were made up of individuals and 10.40% had someone living alone who was 65 years of age or older. The average household size was 2.62 and the average family size was 3.08.
In the county, the population was spread out with 27.60% under the age of 18, 8.70% from 18 to 24, 29.50% from 25 to 44, 21.40% from 45 to 64, and 12.80% who were 65 years of age or older. The median age was 35 years. For every 100 females, there were 94.50 males. For every 100 females age 18 and over, there were 90.80 males.
The median income for a household in the county was $32,055, and the median income for a family was $39,845. Males had a median income of $29,074 versus $21,350 for females. The per capita income for the county was $15,658. About 10.20% of families and 13.80% of the population were below the poverty line, including 15.00% of those under age 18 and 23.30% of those age 65 or over.
Communities
City
- Pontotoc (county seat)
Towns
- Algoma
- Ecru
- Sherman (partly in Union County and Lee County)
- Thaxton
- Toccopola
Unincorporated communities
Politics
| Year | Republican | Democratic | Third parties |
|---|---|---|---|
| 2016 | 79.6% 10,336 | 18.4% 2,386 | 2.0% 262 |
| 2012 | 76.1% 9,448 | 22.6% 2,804 | 1.3% 159 |
| 2008 | 75.6% 9,727 | 23.2% 2,982 | 1.2% 159 |
| 2004 | 75.4% 8,480 | 23.7% 2,660 | 0.9% 100 |
| 2000 | 69.4% 6,601 | 29.1% 2,771 | 1.5% 138 |
| 1996 | 55.6% 4,289 | 33.7% 2,597 | 10.7% 823 |
| 1992 | 54.9% 4,595 | 35.4% 2,965 | 9.6% 806 |
| 1988 | 63.8% 4,939 | 35.8% 2,772 | 0.4% 29 |
| 1984 | 67.8% 5,182 | 31.9% 2,434 | 0.4% 27 |
| 1980 | 41.0% 3,198 | 57.7% 4,499 | 1.3% 105 |
| 1976 | 34.6% 2,245 | 62.6% 4,066 | 2.8% 180 |
| 1972 | 89.5% 4,476 | 9.8% 488 | 0.8% 40 |
| 1968 | 12.0% 733 | 9.8% 599 | 78.3% 4,798 |
| 1964 | 79.4% 2,699 | 20.6% 702 | |
| 1960 | 12.1% 328 | 58.6% 1,584 | 29.3% 792 |
| 1956 | 11.9% 335 | 82.5% 2,320 | 5.6% 157 |
| 1952 | 22.1% 648 | 77.9% 2,281 | |
| 1948 | 1.5% 28 | 18.2% 348 | 80.4% 1,539 |
| 1944 | 4.8% 87 | 95.2% 1,716 | |
| 1940 | 3.1% 70 | 96.8% 2,171 | 0.1% 3 |
| 1936 | 3.9% 93 | 95.7% 2,286 | 0.4% 9 |
| 1932 | 1.6% 31 | 98.0% 1,862 | 0.4% 7 |
| 1928 | 14.5% 261 | 85.5% 1,537 | |
| 1924 | 6.7% 86 | 93.3% 1,206 | |
| 1920 | 30.3% 439 | 68.5% 992 | 1.2% 17 |
| 1916 | 7.7% 110 | 92.1% 1,314 | 0.2% 3 |
| 1912 | 4.0% 47 | 85.4% 1,009 | 10.6% 125 |
See also
References
- 1 2 "State & County QuickFacts". United States Census Bureau. Retrieved September 5, 2013.
- ↑ "Find a County". National Association of Counties. Retrieved 2011-06-07.
- ↑ "2010 Census Gazetteer Files". United States Census Bureau. August 22, 2012. Archived from the original on September 28, 2013. Retrieved November 6, 2014.
- ↑ "Population and Housing Unit Estimates". Retrieved June 9, 2017.
- ↑ "U.S. Decennial Census". United States Census Bureau. Retrieved November 6, 2014.
- ↑ "Historical Census Browser". University of Virginia Library. Retrieved November 6, 2014.
- ↑ "Population of Counties by Decennial Census: 1900 to 1990". United States Census Bureau. Retrieved November 6, 2014.
- ↑ "Census 2000 PHC-T-4. Ranking Tables for Counties: 1990 and 2000" (PDF). United States Census Bureau. Retrieved November 6, 2014.
- 1 2 "American FactFinder". United States Census Bureau. Retrieved 2008-01-31.
- ↑ Leip, David. "Dave Leip's Atlas of U.S. Presidential Elections". uselectionatlas.org. Retrieved 2018-03-05.
| Wikimedia Commons has media related to Pontotoc County, Mississippi. |
Coordinates: 34°14′N 89°02′W / 34.23°N 89.04°W
Places adjacent to Pontotoc County, Mississippi | ||||||||||
|---|---|---|---|---|---|---|---|---|---|---|
| ||||||||||
Municipalities and communities of Pontotoc County, Mississippi, United States | ||
|---|---|---|
| City | | |
| Towns | ||
| Unincorporated Communities | ||
| Footnotes | ‡This populated place also has portions in an adjacent county or counties | |
.svg.png)