Itawamba County, Mississippi
| Itawamba County, Mississippi | |
|---|---|
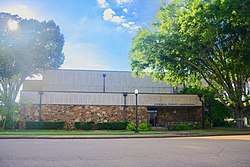 Itawamba County Courthouse in Fulton | |
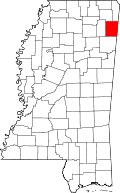 Location in the U.S. state of Mississippi | |
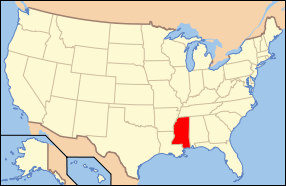 Mississippi's location in the U.S. | |
| Founded | 1836 |
| Named for | Levi Colbert (Itawamba) |
| Seat | Fulton |
| Largest city | Fulton |
| Area | |
| • Total | 540 sq mi (1,399 km2) |
| • Land | 533 sq mi (1,380 km2) |
| • Water | 7.7 sq mi (20 km2), 1.4% |
| Population | |
| • (2010) | 23,401 |
| • Density | 44/sq mi (17/km2) |
| Congressional district | 1st |
| Time zone | Central: UTC−6/−5 |
| Website |
itawambacoms |
Itawamba County is a county located in the U.S. state of Mississippi. As of the 2010 census, the population was 23,401.[1] Its county seat is Fulton.[2] The county is part of the Tupelo, MS Micropolitan Statistical Area.
The county was named for the Chickasaw leader Itawamba, known to English-speaking settlers as Levi Colbert. He was prominent during the Indian Removal period of the early 19th century, but died before his people left the area. The county was the site of the 2010 Itawamba County School District prom controversy when a lesbian student attempted to bring her partner to prom.
Geography
According to the U.S. Census Bureau, the county has a total area of 540 square miles (1,400 km2), of which 533 square miles (1,380 km2) is land and 7.7 square miles (20 km2) (1.4%) is water.[3]
Major highways
Adjacent counties
- Tishomingo County (northeast)
- Franklin County, Alabama (east)
- Marion County, Alabama (southeast)
- Monroe County (south)
- Lee County (west)
- Prentiss County (northwest)
National protected area
- Natchez Trace Parkway (part)
- Pharr Mounds (near Tupelo), 85-acre (340,000 m2) complex of earthwork burial mounds from the Middle Woodland period
Demographics
| Historical population | |||
|---|---|---|---|
| Census | Pop. | %± | |
| 1840 | 5,375 | — | |
| 1850 | 13,528 | 151.7% | |
| 1860 | 17,695 | 30.8% | |
| 1870 | 7,812 | −55.9% | |
| 1880 | 10,663 | 36.5% | |
| 1890 | 11,708 | 9.8% | |
| 1900 | 13,544 | 15.7% | |
| 1910 | 14,526 | 7.3% | |
| 1920 | 15,647 | 7.7% | |
| 1930 | 18,225 | 16.5% | |
| 1940 | 19,922 | 9.3% | |
| 1950 | 17,216 | −13.6% | |
| 1960 | 15,080 | −12.4% | |
| 1970 | 16,847 | 11.7% | |
| 1980 | 20,518 | 21.8% | |
| 1990 | 20,017 | −2.4% | |
| 2000 | 22,770 | 13.8% | |
| 2010 | 23,401 | 2.8% | |
| Est. 2016 | 23,529 | [4] | 0.5% |
| U.S. Decennial Census[5] 1790-1960[6] 1900-1990[7] 1990-2000[8] 2010-2013[1] | |||
As of the census[9] of 2000, there were 22,770 people, 8,773 households, and 6,500 families residing in the county. The population density was 43 people per square mile (17/km²). There were 9,804 housing units at an average density of 18 per square mile (7/km²). The racial makeup of the county was 92.47% White, 6.47% Black or African American, 0.14% Native American, 0.18% Asian, 0.32% from other races, and 0.42% from two or more races. 0.99% of the population were Hispanic or Latino of any race.
In 2000, there were 8,773 households out of which 33.20% had children under the age of 18 living with them, 60.30% were married couples living together, 9.90% had a female householder with no husband present, and 25.90% were non-families. 23.40% of all households were made up of individuals and 11.10% had someone living alone who was 65 years of age or older. The average household size was 2.51 and the average family size was 2.95.
In the county, the population was spread out with 24.20% under the age of 18, 10.60% from 18 to 24, 27.80% from 25 to 44, 23.20% from 45 to 64, and 14.20% who were 65 years of age or older. The median age was 36 years. For every 100 females, there were 94.10 males. For every 100 females age 18 and over, there were 92.50 males.
The median income for a household in the county was $31,156, and the median income for a family was $36,793. Males had a median income of $29,231 versus $20,900 for females. The per capita income for the county was $14,956. About 10.10% of families and 14.00% of the population were below the poverty line, including 15.70% of those under age 18 and 23.60% of those age 65 or over.
Communities
City
- Fulton (county seat)
Towns
Unincorporated communities
- Beans Ferry
- Bounds Crossroads
- Carolina
- Clay
- Dorsey
- Evergreen
- Fairview
- Kirkville
- Peaceful Valley
- Sandy Springs
- Tilden
Ghost towns
- Rara Avis
- Reedsville
- Ryan's Well
- Van Buren
- Wheeling
- Yale
Notable people
- Tammy Wynette, American country music legend, was born near Tremont.
- Delphia Spencer Hankins, an American supercentenarian, was born in Itawamba County.
- John E. Rankin, sixteen-term Democratic U.S. Congressman (1920-1952)
Politics
| Year | Republican | Democratic | Third parties |
|---|---|---|---|
| 2016 | 87.0% 8,470 | 11.5% 1,117 | 1.5% 150 |
| 2012 | 79.3% 7,393 | 18.3% 1,706 | 2.4% 219 |
| 2008 | 77.0% 7,663 | 20.9% 2,084 | 2.1% 204 |
| 2004 | 70.3% 6,833 | 28.8% 2,802 | 0.8% 79 |
| 2000 | 63.3% 5,424 | 35.0% 2,994 | 1.7% 146 |
| 1996 | 48.2% 3,490 | 41.3% 2,987 | 10.5% 760 |
| 1992 | 47.5% 4,142 | 41.7% 3,635 | 10.8% 936 |
| 1988 | 59.0% 4,535 | 40.9% 3,143 | 0.2% 15 |
| 1984 | 63.0% 4,587 | 36.7% 2,674 | 0.3% 24 |
| 1980 | 37.0% 2,906 | 61.8% 4,852 | 1.2% 95 |
| 1976 | 32.1% 2,153 | 66.8% 4,480 | 1.1% 72 |
| 1972 | 89.2% 4,419 | 10.3% 509 | 0.5% 26 |
| 1968 | 9.2% 569 | 6.7% 417 | 84.1% 5,204 |
| 1964 | 65.5% 2,140 | 34.5% 1,127 | |
| 1960 | 13.2% 366 | 63.2% 1,752 | 23.6% 653 |
| 1956 | 11.2% 298 | 86.7% 2,310 | 2.1% 57 |
| 1952 | 19.9% 556 | 80.1% 2,236 | |
| 1948 | 2.9% 50 | 36.5% 634 | 60.6% 1,051 |
| 1944 | 11.9% 183 | 88.1% 1,350 | |
| 1940 | 6.8% 119 | 92.6% 1,627 | 0.7% 12 |
| 1936 | 3.1% 47 | 96.9% 1,465 | |
| 1932 | 2.1% 40 | 97.7% 1,851 | 0.2% 4 |
| 1928 | 27.9% 331 | 72.1% 854 | |
| 1924 | 6.5% 62 | 93.5% 888 | 0.0% 0 |
| 1920 | 16.2% 198 | 83.6% 1,023 | 0.3% 3 |
| 1916 | 11.6% 184 | 88.4% 1,407 | 0.1% 1 |
| 1912 | 2.4% 24 | 89.4% 914 | 8.3% 85 |
See also
References
- 1 2 "State & County QuickFacts". United States Census Bureau. Archived from the original on July 12, 2011. Retrieved September 3, 2013.
- ↑ "Find a County". National Association of Counties. Archived from the original on 2011-05-31. Retrieved 2011-06-07.
- ↑ "2010 Census Gazetteer Files". United States Census Bureau. August 22, 2012. Archived from the original on September 28, 2013. Retrieved November 4, 2014.
- ↑ "Population and Housing Unit Estimates". Retrieved June 9, 2017.
- ↑ "U.S. Decennial Census". United States Census Bureau. Archived from the original on May 12, 2015. Retrieved November 4, 2014.
- ↑ "Historical Census Browser". University of Virginia Library. Retrieved November 4, 2014.
- ↑ "Population of Counties by Decennial Census: 1900 to 1990". United States Census Bureau. Retrieved November 4, 2014.
- ↑ "Census 2000 PHC-T-4. Ranking Tables for Counties: 1990 and 2000" (PDF). United States Census Bureau. Retrieved November 4, 2014.
- ↑ "American FactFinder". United States Census Bureau. Retrieved 2008-01-31.
- ↑ Leip, David. "Dave Leip's Atlas of U.S. Presidential Elections". uselectionatlas.org. Retrieved 2018-03-05.
External links

- Itawamba Historical Society
- Lee-Itawamba Library System at SirsiDynix
Places adjacent to Itawamba County, Mississippi | ||||||||||
|---|---|---|---|---|---|---|---|---|---|---|
| ||||||||||
.svg.png)