Franklin County, Mississippi
| Franklin County, Mississippi | |
|---|---|
.jpg) Monument at Midway Cemetery, Meadville, Mississippi. | |
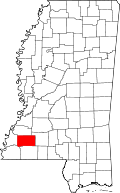 Location in the U.S. state of Mississippi | |
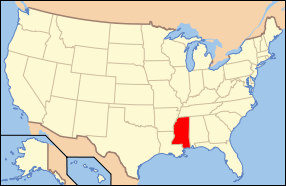 Mississippi's location in the U.S. | |
| Founded | 1809 |
| Named for | Benjamin Franklin |
| Seat | Meadville |
| Largest town | Bude |
| Area | |
| • Total | 567 sq mi (1,469 km2) |
| • Land | 564 sq mi (1,461 km2) |
| • Water | 3.0 sq mi (8 km2), 0.5% |
| Population | |
| • (2010) | 8,118 |
| • Density | 14/sq mi (5/km2) |
| Congressional district | 3rd |
| Time zone | Central: UTC−6/−5 |
| Website |
www |
Franklin County is a county located in the U.S. state of Mississippi. As of the 2010 census, the population was 8,118,[1] making it the fourth-least populous county in Mississippi. Its county seat is Meadville.[2] The county was formed on December 21, 1809 from portions of Adams County and named for Founding Father Benjamin Franklin.[3] It is bisected by the Homochitto River, which runs diagonally through the county from northeast to southwest.
History
This was the fourth county organized in Mississippi. It was initially developed for agriculture, specifically cotton plantations based on enslaved labor of African Americans. Cotton continued to be important to the economy through the 19th century and into the early 20th century.
This still rural county has had a decline in population by about half since 1910. It is the fourth least populous county in the state. Mechanization of agriculture and the blight of the boll weevil both reduced the need for farm workers; they left the area and often the state. Many African Americans went north or west in the Great Migration before and after World War II. The county in the 21st century is majority white in population; in the 2000 census, African Americans composed more than 36% of the population. (See Demographics section below.)
As in the rest of the state, the county had racially segregated facilities under Jim Crow from the late 19th century. Many white residents opposed the civil rights movement of the mid-20th century. In May 1964, Ku Klux Klan members abducted and killed two young black men, Henry Hezekiah Dee and Charles Eddie Moore of Meadville, before Freedom Summer started. Their bodies were not discovered in the Mississippi River until July 1964, during the hunt for three disappeared civil rights workers.
No one was prosecuted at the time, but the case was reopened in 2007, after a documentary had been released on it by Canadian Broadcasting Company. Local man James Ford Seale was convicted of the kidnappings and deaths by an all-white jury in federal court.[4] In 2008 the families of Dee and Moore filed a civil suit against the Franklin County government, charging complicity by its law enforcement in the deaths. On June 21, 2010 Franklin County agreed to an undisclosed settlement in the civil suit with the families of Charles Moore and Henry Dee.[5][6][7] [8]
Geography
According to the U.S. Census Bureau, the county has a total area of 567 square miles (1,470 km2), of which 564 square miles (1,460 km2) is land and 3.0 square miles (7.8 km2) (0.5%) is water.[9]
Major highways
Adjacent counties
- Jefferson County (north)
- Lincoln County (east)
- Amite County (south)
- Wilkinson County (southwest)
- Adams County (west)
National protected area
- Homochitto National Forest (part)
Demographics
| Historical population | |||
|---|---|---|---|
| Census | Pop. | %± | |
| 1810 | 2,016 | — | |
| 1820 | 3,821 | 89.5% | |
| 1830 | 4,622 | 21.0% | |
| 1840 | 4,775 | 3.3% | |
| 1850 | 5,904 | 23.6% | |
| 1860 | 8,265 | 40.0% | |
| 1870 | 7,498 | −9.3% | |
| 1880 | 9,729 | 29.8% | |
| 1890 | 10,424 | 7.1% | |
| 1900 | 13,678 | 31.2% | |
| 1910 | 15,193 | 11.1% | |
| 1920 | 14,156 | −6.8% | |
| 1930 | 12,268 | −13.3% | |
| 1940 | 12,504 | 1.9% | |
| 1950 | 10,929 | −12.6% | |
| 1960 | 9,286 | −15.0% | |
| 1970 | 8,011 | −13.7% | |
| 1980 | 8,208 | 2.5% | |
| 1990 | 8,377 | 2.1% | |
| 2000 | 8,448 | 0.8% | |
| 2010 | 8,118 | −3.9% | |
| Est. 2016 | 7,782 | [10] | −4.1% |
| U.S. Decennial Census[11] 1790-1960[12] 1900-1990[13] 1990-2000[14] 2010-2013[1] | |||
As of the census[15] of 2000, there were 8,448 people, 3,211 households, and 2,337 families residing in the county. The population density was 15 people per square mile (6/km²). There were 4,119 housing units at an average density of 7 per square mile (3/km²). The racial makeup of the county was 62.80% White, 36.27% Black or African American, 0.22% Native American, 0.07% Asian, 0.05% from other races, and 0.59% from two or more races. 0.53% of the population were Hispanic or Latino of any race.
There were 3,211 households out of which 34.60% had children under the age of 18 living with them, 54.20% were married couples living together, 14.60% had a female householder with no husband present, and 27.20% were non-families. 25.60% of all households were made up of individuals and 13.30% had someone living alone who was 65 years of age or older. The average household size was 2.60 and the average family size was 3.13.
In the county, the population was spread out with 27.30% under the age of 18, 8.80% from 18 to 24, 26.10% from 25 to 44, 22.60% from 45 to 64, and 15.20% who were 65 years of age or older. The median age was 37 years. For every 100 females there were 92.30 males. For every 100 females age 18 and over, there were 86.10 males.
The median income for a household in the county was $24,885, and the median income for a family was $31,114. Males had a median income of $26,676 versus $19,567 for females. The per capita income for the county was $13,643. About 20.60% of families and 24.10% of the population were below the poverty line, including 32.10% of those under age 18 and 24.10% of those age 65 or over.
According to CNN, the U.S. Census Bureau reports that no same-sex couples live in Franklin County.[16]
Politics
In the 1964 Presidential election Barry Goldwater reportedly received 96.05% of the county's vote.[17] Although the white-majority county has supported Southern Democrats such as Jimmy Carter for the presidency, since 2000 the Republican candidate has consistently received over 60% of the vote.[18]
| Year | Republican | Democratic | Third parties |
|---|---|---|---|
| 2016 | 63.4% 2,721 | 35.0% 1,502 | 1.6% 67 |
| 2012 | 60.9% 2,735 | 38.4% 1,726 | 0.7% 32 |
| 2008 | 62.1% 2,909 | 37.0% 1,733 | 0.9% 43 |
| 2004 | 64.4% 2,893 | 35.1% 1,574 | 0.5% 24 |
| 2000 | 61.4% 2,427 | 37.6% 1,486 | 1.0% 40 |
| 1996 | 47.5% 1,586 | 41.4% 1,381 | 11.1% 372 |
| 1992 | 49.3% 1,942 | 40.3% 1,587 | 10.4% 409 |
| 1988 | 60.0% 2,376 | 39.5% 1,563 | 0.6% 23 |
| 1984 | 62.9% 2,564 | 36.6% 1,494 | 0.5% 21 |
| 1980 | 49.3% 2,026 | 49.7% 2,040 | 1.1% 43 |
| 1976 | 50.6% 1,719 | 46.5% 1,578 | 2.9% 98 |
| 1972 | 78.7% 2,361 | 18.7% 561 | 2.6% 77 |
| 1968 | 6.7% 231 | 22.7% 782 | 70.6% 2,429 |
| 1964 | 96.1% 2,211 | 4.0% 91 | |
| 1960 | 7.4% 124 | 26.3% 441 | 66.4% 1,115 |
| 1956 | 11.5% 177 | 55.8% 862 | 32.7% 505 |
| 1952 | 30.6% 514 | 69.4% 1,166 | |
| 1948 | 1.0% 12 | 4.5% 55 | 94.5% 1,160 |
| 1944 | 3.9% 49 | 96.1% 1,211 | |
| 1940 | 2.1% 29 | 97.9% 1,376 | |
| 1936 | 2.9% 33 | 96.8% 1,098 | 0.3% 3 |
| 1932 | 2.5% 25 | 97.5% 965 | |
| 1928 | 16.7% 181 | 83.3% 905 | |
| 1924 | 5.7% 36 | 94.3% 591 | |
| 1920 | 24.0% 203 | 75.7% 641 | 0.4% 3 |
| 1916 | 2.8% 22 | 96.5% 769 | 0.8% 6 |
| 1912 | 1.1% 4 | 82.7% 301 | 16.2% 59 |
Communities
Towns
Unincorporated communities
- Eddiceton
- Hamburg
- Knoxville
- Lucien
- McCall Creek
- Quentin
See also
References
- 1 2 "State & County QuickFacts". United States Census Bureau. Archived from the original on July 10, 2011. Retrieved September 3, 2013.
- ↑ "Find a County". National Association of Counties. Archived from the original on 2011-05-31. Retrieved 2011-06-07.
- ↑ Gannett, Henry (1905). The Origin of Certain Place Names in the United States. Govt. Print. Off. p. 131.
- ↑ "Ex-KKK man guilty in 1964 killing". BBC.com. 2007-06-15. Retrieved 2008-08-26.
- ↑ "Families sue Franklin over Klan slayings". Clarion Ledger. 2008-08-07. Retrieved 2008-08-26.
- ↑ "Dee, Moore families files suit against Franklin County, Miss., in 1964 murders". Concordia Sentinel. 2008-08-11. Retrieved 2008-08-26.
- ↑ Walker, Adrian (2008-08-08). "A righteous quest". The Boston Globe.com. Retrieved 2008-08-26.
- ↑ "Miss. Officials Agree To Settlement In '64 Slayings". NPR. 2010-06-21.
- ↑ "2010 Census Gazetteer Files". United States Census Bureau. August 22, 2012. Archived from the original on September 28, 2013. Retrieved November 3, 2014.
- ↑ "Population and Housing Unit Estimates". Retrieved June 9, 2017.
- ↑ "U.S. Decennial Census". United States Census Bureau. Archived from the original on May 12, 2015. Retrieved November 3, 2014.
- ↑ "Historical Census Browser". University of Virginia Library. Retrieved November 3, 2014.
- ↑ "Population of Counties by Decennial Census: 1900 to 1990". United States Census Bureau. Retrieved November 3, 2014.
- ↑ "Census 2000 PHC-T-4. Ranking Tables for Counties: 1990 and 2000" (PDF). United States Census Bureau. Retrieved November 3, 2014.
- ↑ "American FactFinder". United States Census Bureau. Archived from the original on 2013-09-11. Retrieved 2008-01-31.
- ↑ "The county where no one's gay". cnn.com. Retrieved 24 March 2013.
- ↑ David Leip's Presidential Election Atlas - 1964 statistics
- ↑ The New York Times Electoral Map (Zoom in on Mississippi)
- ↑ Leip, David. "Dave Leip's Atlas of U.S. Presidential Elections". uselectionatlas.org. Retrieved 2018-03-03.
External links
Places adjacent to Franklin County, Mississippi | ||||||||||
|---|---|---|---|---|---|---|---|---|---|---|
| ||||||||||
Municipalities and communities of Franklin County, Mississippi, United States | ||
|---|---|---|
| Towns | | |
| Unincorporated communities | ||
.svg.png)