Walthall County, Mississippi
| Walthall County, Mississippi | |
|---|---|
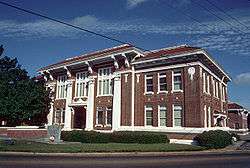 Walthall County courthouse in Tylertown | |
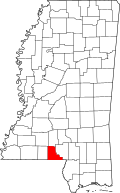 Location in the U.S. state of Mississippi | |
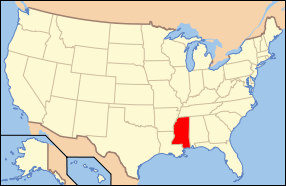 Mississippi's location in the U.S. | |
| Founded | 1910 |
| Named for | Edward C. Walthall |
| Seat | Tylertown |
| Largest town | Tylertown |
| Area | |
| • Total | 404 sq mi (1,046 km2) |
| • Land | 404 sq mi (1,046 km2) |
| • Water | 0.5 sq mi (1 km2), 0.1% |
| Population | |
| • (2010) | 15,443 |
| • Density | 38/sq mi (15/km2) |
| Congressional district | 3rd |
| Time zone | Central: UTC−6/−5 |
| Website |
www |
Walthall County is a county located in the U.S. state of Mississippi. As of the 2010 census, the population was 15,443.[1] Its county seat is Tylertown.[2] The county is named after Civil War general and Mississippi Senator Edward C. Walthall.
Geography
According to the U.S. Census Bureau, the county has a total area of 404 square miles (1,050 km2), of which 404 square miles (1,050 km2) is land and 0.5 square miles (1.3 km2) (0.1%) is water.[3] It is the second-smallest county in Mississippi by area.
Walthall County is located in Southwest Mississippi.
Major highways


Adjacent counties
- Lawrence County (north)
- Marion County (east)
- Washington Parish, Louisiana (south)
- Pike County (west)
- Lincoln County (northwest)
Demographics
| Historical population | |||
|---|---|---|---|
| Census | Pop. | %± | |
| 1920 | 13,455 | — | |
| 1930 | 13,871 | 3.1% | |
| 1940 | 17,534 | 26.4% | |
| 1950 | 15,563 | −11.2% | |
| 1960 | 13,512 | −13.2% | |
| 1970 | 12,500 | −7.5% | |
| 1980 | 13,761 | 10.1% | |
| 1990 | 14,352 | 4.3% | |
| 2000 | 15,156 | 5.6% | |
| 2010 | 15,443 | 1.9% | |
| Est. 2016 | 14,599 | [4] | −5.5% |
| U.S. Decennial Census[5] 1790-1960[6] 1900-1990[7] 1990-2000[8] 2010-2013[1] | |||
As of the 2010 United States Census, there were 15,443 people residing in the county. 53.4% were White, 44.5% Black or African American, 0.4% Native American, 0.2% Asian, 0.4% of some other race and 1.1% of two or more races. 1.5% were Hispanic or Latino (of any race).
As of the census[9] of 2000, there were 15,156 people, 5,571 households, and 4,111 families residing in the county. The population density was 38 people per square mile (14/km²). There were 6,418 housing units at an average density of 16 per square mile (6/km²). The racial makeup of the county was 54.61% White, 44.09% Black or African American, 0.12% Native American, 0.24% Asian, 0.01% Pacific Islander, 0.26% from other races, and 0.66% from two or more races. 1.33% of the population were Hispanic or Latino of any race.
There were 5,571 households out of which 34.00% had children under the age of 18 living with them, 53.00% were married couples living together, 16.90% had a female householder with no husband present, and 26.20% were non-families. 24.00% of all households were made up of individuals and 11.50% had someone living alone who was 65 years of age or older. The average household size was 2.69 and the average family size was 3.19.
In the county, the population was spread out with 28.40% under the age of 18, 9.90% from 18 to 24, 25.40% from 25 to 44, 22.30% from 45 to 64, and 14.10% who were 65 years of age or older. The median age was 35 years. For every 100 females there were 91.50 males. For every 100 females age 18 and over, there were 86.20 males.
The median income for a household in the county was $22,945, and the median income for a family was $29,169. Males had a median income of $26,745 versus $16,909 for females. The per capita income for the county was $12,563. About 22.40% of families and 27.80% of the population were below the poverty line, including 42.70% of those under age 18 and 17.50% of those age 65 or over.
Communities
Town
- Tylertown (county seat)
Unincorporated communities
- Darbun
- Dexter
- Improve
- Mesa
- Salem
- Sartinville
- Union
- Hope
Politics
| Year | Republican | Democratic | Third parties |
|---|---|---|---|
| 2016 | 58.6% 4,056 | 40.3% 2,790 | 1.1% 73 |
| 2012 | 53.7% 4,051 | 45.3% 3,422 | 1.0% 78 |
| 2008 | 54.7% 4,253 | 44.4% 3,456 | 0.9% 71 |
| 2004 | 61.2% 3,888 | 38.3% 2,435 | 0.5% 33 |
| 2000 | 59.0% 3,476 | 40.0% 2,356 | 1.1% 63 |
| 1996 | 45.3% 2,239 | 45.3% 2,240 | 9.5% 467 |
| 1992 | 45.7% 2,728 | 41.5% 2,476 | 12.8% 763 |
| 1988 | 56.4% 3,103 | 42.8% 2,354 | 0.8% 45 |
| 1984 | 59.7% 3,305 | 40.1% 2,219 | 0.3% 17 |
| 1980 | 46.9% 2,703 | 51.4% 2,960 | 1.7% 99 |
| 1976 | 42.8% 2,110 | 53.8% 2,650 | 3.4% 167 |
| 1972 | 79.7% 3,110 | 19.1% 747 | 1.2% 47 |
| 1968 | 8.1% 387 | 25.7% 1,233 | 66.3% 3,186 |
| 1964 | 95.1% 3,014 | 4.9% 154 | |
| 1960 | 14.5% 310 | 34.9% 747 | 50.6% 1,082 |
| 1956 | 17.7% 306 | 66.3% 1,143 | 16.0% 276 |
| 1952 | 26.6% 491 | 73.4% 1,357 | |
| 1948 | 0.4% 5 | 6.6% 85 | 93.0% 1,202 |
| 1944 | 5.2% 68 | 94.8% 1,230 | |
| 1940 | 3.2% 40 | 96.7% 1,206 | 0.1% 1 |
| 1936 | 2.2% 28 | 97.7% 1,234 | 0.1% 1 |
| 1932 | 2.7% 30 | 97.1% 1,069 | 0.2% 2 |
| 1928 | 20.2% 218 | 79.9% 864 | |
| 1924 | 8.8% 64 | 91.2% 660 | |
| 1920 | 22.5% 139 | 75.1% 464 | 2.4% 15 |
| 1916 | 1.7% 12 | 96.7% 665 | 1.6% 11 |
See also
References
- 1 2 "State & County QuickFacts". United States Census Bureau. Retrieved September 7, 2013.
- ↑ "Find a County". National Association of Counties. Retrieved 2011-06-07.
- ↑ "2010 Census Gazetteer Files". United States Census Bureau. August 22, 2012. Archived from the original on September 28, 2013. Retrieved November 8, 2014.
- ↑ "Population and Housing Unit Estimates". Retrieved June 9, 2017.
- ↑ "U.S. Decennial Census". United States Census Bureau. Retrieved November 8, 2014.
- ↑ "Historical Census Browser". University of Virginia Library. Retrieved November 8, 2014.
- ↑ "Population of Counties by Decennial Census: 1900 to 1990". United States Census Bureau. Retrieved November 8, 2014.
- ↑ "Census 2000 PHC-T-4. Ranking Tables for Counties: 1990 and 2000" (PDF). United States Census Bureau. Retrieved November 8, 2014.
- ↑ "American FactFinder". United States Census Bureau. Retrieved 2008-01-31.
- ↑ Leip, David. "Dave Leip's Atlas of U.S. Presidential Elections". uselectionatlas.org. Retrieved 2018-03-03.
Places adjacent to Walthall County, Mississippi | ||||||||||
|---|---|---|---|---|---|---|---|---|---|---|
| ||||||||||
Municipalities and communities of Walthall County, Mississippi, United States | ||
|---|---|---|
| Town | | |
| Unincorporated communities |
| |
.svg.png)