White Americans
White Americans are Americans who are descendants from any of the white racial groups of Europe, the Middle East, and North Africa, or in census statistics, those who self-report as white based on having majority-white ancestry. White Americans (including White Hispanics) constitute the majority of the people living in the United States, with 72.4% of the population in the 2010 United States Census. Non-Hispanic whites totaled about 197,285,202 or 60% of the U.S. population.[3]
The United States Census Bureau defines white people as those "having origins in any of the original peoples of Europe, the Middle East, or North Africa."[4] Like all official U.S. racial categories, "White" has a "not Hispanic or Latino" and a "Hispanic or Latino" component,[5] the latter consisting mostly of white Mexican Americans and white Cuban Americans. The term "Caucasian" is erroneously considered interchangeable with "white", although the latter is used in the more narrow sense of white-skinned.[6][7][8][9][10][11] The inclusion of non-Europeans in the definition of white is controversial. Many of the non-European ethnic groups classified as white by the U.S. Census, such as Arab Americans,[12] Jewish Americans,[13][14][15][16] and Hispanics or Latinos, may not identify as, or may not perceived to be, white.
The largest ancestries of American whites are: German Americans (16.5%), Irish Americans (11.9%), English Americans (9.2%), Italian Americans (5.8%), French Americans (4%), Polish Americans (3%), Scottish Americans (1.9%), Scotch-Irish Americans (1.7%), Dutch Americans (1.6%), Norwegian Americans (1.5%), and Swedish Americans (1.4%).[17][18][19] However, the English Americans and British Americans demography is considered a serious under-count as the stock tend to self-report and identify as simply "Americans" (6.9%), due to the length of time they have inhabited the United States, particularly if their family came prior to the American Revolution.[8][9][10][11] Many white Americans also have ancestry from multiple countries.
Historical and present definitions
Definitions of who is "White" have changed throughout the history of the United States.
U.S. Census definition
The term "White American" can encompass many different ethnic groups. Although the United States Census purports to reflect a social definition of race, the social dimensions of race are more complex than Census criteria. The 2000 U.S. census states that racial categories "generally reflect a social definition of race recognized in this country. They do not conform to any biological, anthropological or genetic criteria."[20]
The Census question on race lists the categories White or European American, Black or African American, American Indian and Alaska Native, Native Hawaiian or Other Pacific Islander, Asian, plus "Some other race", with the respondent having the ability to mark more than one racial and or ethnic category. The Census Bureau defines White people as follows:
"White" refers to a person having origins in any of the original peoples of Europe, the Middle East or North Africa. It includes people who indicated their race(s) as "White" or reported entries such as Irish, German, Italian, Lebanese, Arab, Moroccan or Caucasian.[4]
In U.S. census documents, the designation White overlaps, as do all other official racial categories, with the term Hispanic or Latino, which was introduced in the 1980 census as a category of ethnicity, separate and independent of race.[21][22] Hispanic and Latino Americans as a whole make up a racially diverse group and as a whole are the largest minority in the country.[23][24]
The characterization of Middle Eastern and North African Americans as white has been a matter of controversy. In the early 20th century, peoples of Arab descent were sometimes denied entry into the United States because they were characterized as nonwhite.[25] In 1944, the law changed, and Middle Eastern and North African peoples were granted white status. The U.S. Census is currently revisiting the issue, and considering creating a separate racial category for Middle Eastern and North African Americans in the 2020 Census.

.jpg)
In cases where individuals do not self-identify, the U.S. census parameters for race give each national origin a racial value.
Additionally, people who reported Muslim (or a sect of Islam such as Shi'ite or Sunni), Jewish, Zoroastrian, or Caucasian as their "race" in the "Some other race" section, without noting a country of origin, are automatically tallied as White.[27] The US Census considers the write-in response of "Caucasian" or "Aryan" to be a synonym for White in their ancestry code listing.[28]
Social definition
In the contemporary United States, essentially anyone of European descent is considered White. However, many of the non-European ethnic groups classified as White by the U.S. Census, such as Arab Americans, Jewish Americans, and Hispanics or Latinos may not identify as, and may not be perceived to be, White.[29][13][14][15][16][30]
The definition of White has changed significantly over the course of American history. Among Europeans, those not considered White at some point in American history include Italians, Greeks, Spaniards, Irish, Swedes, Finns, and Russians.[30][31][32] Early on in the United States, membership in the white race was generally limited to those of British, Germanic, or Nordic ancestry.[33]
David R. Roediger argues that the construction of the white race in the United States was an effort to mentally distance slave owners from slaves.[34] The process of officially being defined as white by law often came about in court disputes over pursuit of citizenship.[35]
Critical race theory definition
Critical race theory developed in the 1970s and 1980s, influenced by the language of critical legal studies, which challenged concepts such as objective truth, rationality and judicial neutrality, and by critical theory.[36] Academics and activists disillusioned with the outcomes of the Civil Rights Movement pointed out that though African Americans supposedly enjoyed legal equality, white Americans continued to hold disproportionate power and still had superior living standards.[37] Liberal ideas such as meritocracy and equal opportunity, they argued, hid and reinforced deep structural inequalities and thus serves the interests of a white elite.[38] Critical race theorists see racism as embedded in public attitudes and institutions, and highlight institutional racism and unconscious biases.[39] Legal scholar Derrick Bell advanced the interest convergence principle, which suggests that whites support minority rights only when doing so is also in their self-interest.[40][41]
As Whites, especially White Anglo-Saxon Protestants, or WASPs, are the dominant racial and cultural group, according to sociologist Steven Seidman, writing from a critical theory perspective, "White culture constitutes the general cultural mainstream, causing non-White culture to be seen as deviant, in either a positive or negative manner. Moreover, Whites tend to be disproportionately represented in powerful positions, controlling almost all political, economic, and cultural institutions."
Yet, according to Seidman, Whites are most commonly unaware of their privilege and the manner in which their culture has always been dominant in the US, as they do not identify as members of a specific racial group but rather incorrectly perceive their views and culture as "raceless", when in fact it is ethno-national (ethnic/cultural) specific, with a racial base component.[42]
Demographic information
| Self-identified as White 1790–2010 | |||||||
|---|---|---|---|---|---|---|---|
| Year | Population | % of the U.S. |
% change (10 yr) |
Year | Population | % of the U.S. |
% change (10 yr) |
| 1790 | 3,172,006 | 80.7 | 1910 | 81,731,957 | 88.9 | ||
| 1800 | 4,306,446 | 81.1 | 1920 | 94,820,915 | 89.7 | ||
| 1810 | 5,862,073 | 81.0 | 1930 | 110,286,740 | 89.8 | ||
| 1820 | 7,866,797 | 81.6 | 1940 | 118,214,870 | 89.8 (highest) | ||
| 1830 | 10,532,060 | 81.9 | 1950 | 134,942,028 | 89.5 | ||
| 1840 | 14,189,705 | 83.2 | 1960 | 158,831,732 | 88.6 | ||
| 1850 | 19,553,068 | 84.3 | 1970 | 178,119,221 | 87.5 | ||
| 1860 | 26,922,537 | 85.6 | 1980 | 188,371,622 | 83.1 | ||
| 1870 | 33,589,377 | 87.1 | 1990 | 199,686,070 | 80.3 | ||
| 1880 | 43,402,970 | 86.5 | 2000 | 211,460,626 | 75.1 | ||
| 1890 | 55,101,258 | 87.5 | 2010 | 223,553,265 | 72.4 (lowest) | ||
| 1900 | 66,809,196 | 87.9 | TBD | TBD | TBD | TBD | |
| Source: United States census bureau.[43][44][45][46] | |||||||
White Americans constitute the majority of the 308 million people living in the United States, with 72.4% of the population in the 2010 United States Census.[lower-alpha 1][1][48]
The largest ethnic groups (by ancestry) among White Americans were Germans, followed by Irish and English.[49] In the 1980 census 49,598,035 Americans cited that they were of English ancestry, making them 26% of the country and the largest group at the time, and in fact larger than the population of England itself.[50] Slightly more than half of these people would cite that they were of "American" ancestry on subsequent censuses and virtually everywhere that "American" ancestry predominates on the 2000 census corresponds to places where "English" predominated on the 1980 census.[51][52]
White Americans are projected to remain the majority, though with their percentage decreasing to 72% of the total population by 2050. However, projections state that non-Hispanic Whites of that group will become less than 50% of the population by 2042 because Non-Hispanic Whites have the lowest fertility rate of any major racial group in the United States,[53] mass-immigration of other ethnic groups with higher birth rates, and because of intermarriage with non-whites.
While over ten million White people can trace part of their ancestry back to the Pilgrims who arrived on the Mayflower in 1620 (this common statistic overlooks the Jamestown, Virginia foundations of America and roots of even earlier colonist-descended Americans, such as Spanish Americans in St. Augustine, Florida), over 35 million whites have at least one ancestor who passed through the Ellis Island immigration station, which processed arriving immigrants from 1892 until 1954.
Geographic distribution
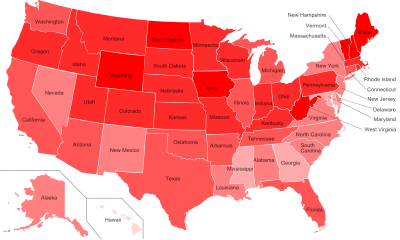
According to the Census definition, White Americans are the majority racial group in almost all of the United States. They are not the majority in Hawaii, many American Indian reservations, parts of the South known as the Black Belt, the District of Columbia, all US territories, and in many urban areas throughout the country. Non-Hispanic whites are also not the majority in several southwestern states.
Overall the highest concentration of those referred to as "Non-Hispanic Whites" by the Census Bureau was found in the Midwest, New England, the Rocky Mountain states, Kentucky, and West Virginia. The lowest concentration of whites was found in southern and mid-Atlantic states.[5][54][55]
Although all large geographical areas are dominated by White Americans, much larger differences can be seen between specific parts of large cities.
States with the highest percentages of White Americans, as of 2007:[56]
- Vermont 96.2%
- Maine 95.5%
- New Hampshire 95.0%
- West Virginia 94.3%
- Iowa 92.9%
- Idaho 92.1%
- Wyoming 91.6%
- Minnesota 90.94%
- North Dakota 90.9%
States with the highest percentages of non-Hispanic Whites, as of 2007:[57]
- Vermont 95.4%
- Maine 94.8%
- West Virginia 93.7%
- New Hampshire 93.4%
- Iowa 90.9%
- North Dakota 90.2%
- Montana 88.3%
- Kentucky 88.1%
- Wyoming 87.7%
- South Dakota 86.5%
Income and educational attainment
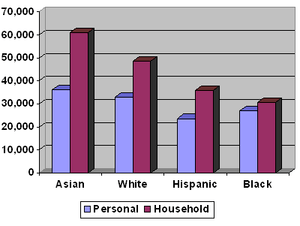
White Americans have the second highest median household income and personal income levels in the nation, by cultural background. The median income per household member was also the highest, since White Americans had the smallest households of any racial demographic in the nation. In 2006, the median individual income of a White American age 25 or older was $33,030, with those who were full-time employed, and of age 25 to 64, earning $34,432. Since 42% of all households had two income earners, the median household income was considerably higher than the median personal income, which was $48,554 in 2005. Jewish Americans rank first in household income, personal income, and educational attainment among White Americans.[58] In 2005, White households had a median household income of $48,977, which is 10.3% above the national median of $44,389. Among Cuban Americans, with 86% classified as White, those born in the US have a higher median income and educational attainment level than most other Whites.[59]
The poverty rates for White Americans are the second-lowest of any racial group, with 10.8% of white individuals living below the poverty line, 3% lower than the national average.[60] However, due to Whites' majority status, 48% of Americans living in poverty are white.[61]
White Americans' educational attainment is the second-highest in the country, after Asian Americans'. Overall, nearly one-third of White Americans had a Bachelor's degree, with the educational attainment for Whites being higher for those born outside the United States: 37.6% of foreign born, and 29.7% of native born Whites had a college degree. Both figures are above the national average of 27.2%.[62]
Gender income inequality was the greatest among Whites, with White men outearning White women by 48%. Census Bureau data for 2005 reveals that the median income of White females was lower than that of males of all races. In 2005, the median income for White American females was only slightly higher than that of African American females.[63]
White Americans are more likely to live in suburbs and small cities than their black counterparts.[64]
Population by state
2000 and 2010 censuses
| State | Pop. 2000 | % 2000 | Pop. 2010 | % 2010 | % growth |
|---|---|---|---|---|---|
| 3,162,808 | 71.1% | 3,275,394 | 68.5% | +3.6% | |
| 434,534 | 69.3% | 473,576 | 66.7% | +9.0% | |
| 3,873,611 | 75.5% | 4,667,121 | 73.0% | +20.5% | |
| 2,138,598 | 80.0% | 2,245,229 | 77.0% | +5.0% | |
| 20,170,059 | 79.7% | 21,453,934 | 74.0% | +6.4% | |
| 3,560,005 | 82.8% | 4,089,202 | 81.3% | +14.9% | |
| 2,780,355 | 81.6% | 2,772,410 | 77.6% | -0.3% | |
| 584,773 | 74.6% | 618,617 | 68.9% | +5.8% | |
| 176,101 | 30.8% | 231,471 | 38.5% | +31.4% | |
| 12,465,029 | 78.0% | 14,109,162 | 75.0% | +13.2% | |
| 5,327,281 | 65.1% | 5,787,440 | 59.7% | +8.6% | |
| 294,102 | 24.3% | 336,599 | 24.7% | +14.4% | |
| 1,177,304 | 91.0% | 1,396,487 | 89.1% | +18.6% | |
| 9,125,471 | 73.5% | 9,177,877 | 71.5% | +0.6% | |
| 5,320,022 | 87.5% | 5,467,906 | 84.3% | +2.8% | |
| 2,748,640 | 93.9% | 2,781,561 | 91.3% | +1.2% | |
| 2,313,944 | 86.1% | 2,391,044 | 83.8% | +3.3% | |
| 3,640,889 | 90.1% | 3,809,537 | 87.8% | +4.6% | |
| 2,856,161 | 63.9% | 2,836,192 | 62.6% | -0.7% | |
| 1,236,014 | 96.9% | 1,264,971 | 95.2% | +2.3% | |
| 3,391,308 | 64.0% | 3,359,284 | 58.2% | -0.9% | |
| 5,367,286 | 84.5% | 5,265,236 | 80.4% | -1.9% | |
| 7,966,053 | 80.2% | 7,803,120 | 78.9% | -2.0% | |
| 4,400,282 | 89.4% | 4,524,062 | 85.3% | +2.8% | |
| 1,746,099 | 61.4% | 1,754,684 | 59.1% | +0.5% | |
| 4,748,083 | 84.9% | 4,958,770 | 82.8% | +4.4% | |
| 817,229 | 90.6% | 884,961 | 89.4% | +8.3% | |
| 1,533,261 | 89.6% | 1,572,838 | 86.1% | +2.6% | |
| 1,501,886 | 75.2% | 1,786,688 | 66.2% | +19.0% | |
| 1,186,851 | 96.0% | 1,236,050 | 92.3% | +4.1% | |
| 6,104,705 | 72.6% | 6,029,248 | 68.6% | -1.2% | |
| 1,214,253 | 66.8% | 1,407,876 | 68.4% | +15.9% | |
| 12,893,689 | 67.9% | 12,740,974 | 65.7% | -1.2% | |
| 5,804,656 | 72.1% | 6,528,950 | 68.5% | +12.5% | |
| 593,181 | 92.4% | 605,449 | 90.0% | +2.1% | |
| 9,645,453 | 85.0% | 9,539,437 | 82.7% | -1.1% | |
| 2,628,434 | 76.2% | 2,706,845 | 72.2% | +3.0% | |
| 2,961,623 | 86.6% | 3,204,614 | 83.6% | +8.2% | |
| 10,484,203 | 85.4% | 10,406,288 | 81.9% | -0.7% | |
| 891,191 | 85.0% | 856,869 | 81.4% | -3.8% | |
| 2,695,560 | 67.2% | 3,060,000 | 66.2% | +13.5% | |
| 669,404 | 88.7% | 699,392 | 85.9% | +4.5% | |
| 4,563,310 | 80.2% | 4,921,948 | 77.6% | +7.9% | |
| 14,799,505 | 71.0% | 17,701,552 | 70.4% | +19.6% | |
| 1,992,975 | 89.2% | 2,379,560 | 86.1% | +19.4% | |
| 589,208 | 96.8% | 596,292 | 95.3% | +1.2% | |
| 5,120,110 | 72.3% | 5,486,852 | 68.6% | +7.2% | |
| 4,821,823 | 81.8% | 5,196,362 | 77.3% | +7.8% | |
| 1,718,777 | 95.0% | 1,739,988 | 93.9% | +1.2% | |
| 4,769,857 | 88.9% | 4,902,067 | 86.2% | +2.8% | |
| 454,670 | 92.1% | 511,279 | 90.7% | +12.4% | |
| 211,460,626 | 75.1% | 223,553,265 | 72.4% | +5.7% | |
2015 and 2016 estimates
| State | Pop. 2015 | % 2015 | Pop. 2016 | % 2016 | percentage growth | numeric growth |
|---|---|---|---|---|---|---|
| 3,373,302 | 69.5% | 3,372,524 | 69.3% | -0.2% | -778 | |
| 490,380 | 66.5% | 490,389 | 66.1% | -0.4% | +9 | |
| 5,696,106 | 83.5% | 5,772,667 | 83.3% | -0.2% | +76,561 | |
| 2,369,986 | 79.6% | 2,373,726 | 79.4% | -0.2% | +3,740 | |
| 28,467,494 | 73.0% | 28,539,253 | 72.7% | -0.3% | +71,759 | |
| 4,776,140 | 87.6% | 4,846,441 | 87.5% | -0.1% | +70,301 | |
| 2,900,643 | 80.9% | 2,882,093 | 80.6% | -0.3% | -18,550 | |
| 664,555 | 70.4% | 667,809 | 70.1% | -0.3% | +3,254 | |
| 295,756 | 44.1% | 303,813 | 44.6% | +0.5% | +8,057 | |
| 15,735,811 | 77.7% | 15,996,473 | 77.6% | -0.1% | +260,662 | |
| 6,280,677 | 61.6% | 6,311,001 | 61.2% | -0.4% | +30,324 | |
| 370,398 | 26.0% | 369,064 | 25.8% | -0.2% | -1,334 | |
| 1,545,433 | 93.5% | 1,571,098 | 93.3% | -0.2% | +25,665 | |
| 9,933,221 | 77.4% | 9,885,382 | 77.2% | -0.2% | -47,839 | |
| 5,677,021 | 85.8% | 5,678,630 | 85.6% | -0.2% | +1,609 | |
| 2,861,917 | 91.6% | 2,864,884 | 91.4% | -0.2% | +2,967 | |
| 2,522,857 | 86.8% | 2,518,720 | 86.6% | -0.2% | -4,137 | |
| 3,900,103 | 88.1% | 3,903,419 | 88.0% | -0.1% | +3,316 | |
| 2,953,830 | 63.2% | 2,956,505 | 63.1% | -0.1% | +2,675 | |
| 1,262,043 | 94.9% | 1,262,168 | 94.8% | -0.1% | +125 | |
| 3,574,645 | 59.6% | 3,567,397 | 59.3% | -0.3% | -7,248 | |
| 5,575,530 | 82.2% | 5,570,872 | 81.8% | -0.4% | -4,658 | |
| 7,909,528 | 79.7% | 7,902,903 | 79.6% | -0.1% | -6,625 | |
| 4,678,791 | 85.3% | 4,691,265 | 85.0% | -0.3% | +12,474 | |
| 1,777,735 | 59.4% | 1,772,995 | 59.3% | -0.1% | -4,740 | |
| 5,065,735 | 83.3% | 5,071,682 | 83.2% | -0.1% | +5,947 | |
| 921,719 | 89.3% | 929,802 | 89.2% | -0.1% | +8,083 | |
| 1,687,415 | 89.1% | 1,694,976 | 88.9% | -0.2% | +7,561 | |
| 2,183,208 | 75.7% | 2,209,037 | 75.1% | -0.6% | +25,289 | |
| 1,249,796 | 93.9% | 1,251,893 | 93.8% | -0.1% | +2,097 | |
| 6,496,420 | 72.7% | 6,473,721 | 72.3% | -0.4% | -22,699 | |
| 1,717,860 | 82.6% | 1,718,307 | 82.6% | 0.0 | +447 | |
| 13,860,222 | 70.2% | 13,797,556 | 69.9% | -0.3% | -62,666 | |
| 7,144,627 | 71.2% | 7,206,071 | 71.0% | -0.2% | +61,444 | |
| 669,125 | 88.4% | 665,977 | 87.9% | -0.5% | -3,148 | |
| 9,594,996 | 82.7% | 9,576,321 | 82.4% | -0.3% | -18,675 | |
| 2,922,871 | 74.8% | 2,925,602 | 74.5% | -0.3% | +2,731 | |
| 3,529,292 | 87.7% | 3,578,285 | 87.4% | -0.3% | +48,993 | |
| 10,567,168 | 82.6% | 10,531,113 | 82.4% | -0.2% | -36,055 | |
| 894,570 | 84.7% | 892,045 | 84.4% | -0.3% | -2,525 | |
| 3,348,754 | 68.4% | 3,396,931 | 68.5% | +0.1% | +48,177 | |
| 732,532 | 85.4% | 737,070 | 85.1% | -0.3% | +4,538 | |
| 5,196,817 | 78.8% | 5,234,030 | 78.7% | -0.1% | +37,213 | |
| 21,874,482 | 79.7% | 22,135,668 | 79.4% | -0.3% | +261,186 | |
| 2,730,389 | 91.3% | 2,778,175 | 91.0% | -0.3% | +47,786 | |
| 593,577 | 94.8% | 590,869 | 94.6% | -0.2% | -2,708 | |
| 5,884,689 | 70.3% | 5,891,553 | 70.0% | -0.3% | +6,864 | |
| 5,756,563 | 80.4% | 5,830,144 | 80.0% | -0.4% | +73,581 | |
| 1,725,045 | 93.7% | 1,713,756 | 93.6% | -0.1% | -11,289 | |
| 5,056,456 | 87.6% | 5,057,070 | 87.5% | -0.1% | +614 | |
| 544,777 | 92.8% | 543,387 | 92.8% | 0.0 | -1,390 | |
| 247,543,007 | 77.1% | 248,502,532 | 76.9% | -0.2% | +959,525 |
Non-Hispanic population
| State | Pop. 2015 | % 2015 | Pop. 2016 | % 2016 | percentage growth | numeric growth |
|---|---|---|---|---|---|---|
| 3,206,017 | 66.0% | 3,201,937 | 65.8% | -0.2% | -4,080 | |
| 454,782 | 61.6% | 453,915 | 61.2% | -0.4% | -867 | |
| 3,809,881 | 55.9% | 3,844,532 | 55.5% | -0.4% | +34,651 | |
| 2,178,888 | 73.2% | 2,177,898 | 72.9% | -0.3% | -990 | |
| 14,880,574 | 38.2% | 14,802,979 | 37.7% | -0.5% | -77,595 | |
| 3,753,560 | 68.9% | 3,802,465 | 68.6% | -0.3% | +48,905 | |
| 2,448,730 | 68.3% | 2,420,461 | 67.7% | -0.6% | -28,269 | |
| 597,073 | 63.2% | 598,485 | 62.9% | -0.3% | +1,412 | |
| 242,060 | 36.1% | 248,169 | 36.4% | +0.3% | +6,109 | |
| 11,200,754 | 55.3% | 11,314,909 | 54.9% | -0.4% | +114,155 | |
| 5,493,595 | 53.8% | 5,503,895 | 53.4% | -0.4% | +10,300 | |
| 319,112 | 22.4% | 316,077 | 22.1% | -0.3% | -3,035 | |
| 1,366,457 | 82.7% | 1,386,279 | 82.4% | -0.3% | +19,822 | |
| 7,963,439 | 62.0% | 7,896,462 | 61.7% | -0.3% | -93,977 | |
| 5,290,028 | 80.0% | 5,282,559 | 79.6% | -0.4% | -7,469 | |
| 2,704,016 | 86.6% | 2,702,702 | 86.2% | -0.4% | -1,314 | |
| 2,225,679 | 76.6% | 2,217,600 | 76.3% | -0.3% | -8,079 | |
| 3,770,531 | 85.2% | 3,770,240 | 85.0% | -0.2% | -291 | |
| 2,762,836 | 59.2% | 2,760,505 | 59.0% | -0.2% | -2,331 | |
| 1,245,105 | 93.6% | 1,244,762 | 93.5% | -0.1% | -343 | |
| 3,120,807 | 52.0% | 3,099,419 | 51.5% | -0.5% | -21,388 | |
| 4,993,805 | 73.6% | 4,972,277 | 73.0% | -0.6% | -21,528 | |
| 7,501,007 | 75.6% | 7,486,890 | 75.4% | -0.2% | -14,177 | |
| 4,442,065 | 81.0% | 4,448,493 | 80.6% | -0.4% | +6,428 | |
| 1,706,231 | 57.1% | 1,700,036 | 56.9% | -0.2% | -6,195 | |
| 4,857,656 | 80.0% | 4,857,925 | 79.7% | -0.3% | +269 | |
| 894,287 | 86.6% | 901,301 | 86.4% | -0.2% | +7,014 | |
| 1,515,363 | 80.0% | 1,517,526 | 79.6% | -0.4% | +2,163 | |
| 1,463,294 | 50.7% | 1,468,421 | 49.9% | -0.8% | +5,127 | |
| 1,211,938 | 91.1% | 1,212,634 | 90.8% | -0.3% | +696 | |
| 5,037,204 | 56.4% | 4,990,905 | 55.8% | -0.6% | -46,299 | |
| 798,211 | 38.4% | 792,167 | 38.1% | -0.3% | -6,044 | |
| 11,093,447 | 56.2% | 11,009,263 | 55.7% | -0.5% | -84,184 | |
| 6,407,365 | 63.8% | 6,447,335 | 63.5% | -0.3% | +39,970 | |
| 648,034 | 85.6% | 644,127 | 85.0% | -0.6% | -3,907 | |
| 9,258,140 | 79.8% | 9,230,244 | 79.5% | -0.3% | -27,896 | |
| 2,602,100 | 66.6% | 2,596,769 | 66.1% | -0.5% | -5,331 | |
| 3,090,378 | 76.8% | 3,126,217 | 76.4% | -0.4% | +35,839 | |
| 9,906,474 | 77.4% | 9,848,778 | 77.0% | -0.4% | -57,969 | |
| 780,522 | 73.9% | 774,832 | 73.3% | -0.6% | -5,690 | |
| 3,128,841 | 63.9% | 3,169,878 | 63.9% | 0.0 | +41,037 | |
| 709,991 | 82.7% | 713,665 | 82.5% | -0.2% | +3,674 | |
| 4,910,112 | 74.4% | 4,937,280 | 74.2% | -0.2% | +27,168 | |
| 11,824,057 | 43.1% | 11,872,926 | 42.6% | -0.5% | +48,869 | |
| 2,368,257 | 79.2% | 2,404,802 | 78.8% | -0.4% | +36,545 | |
| 584,256 | 93.3% | 581,225 | 93.0% | -0.3% | -3,031 | |
| 5,261,313 | 62.9% | 5,252,972 | 62.4% | -0.5% | -8,341 | |
| 5,013,824 | 70.0% | 5,062,580 | 69.5% | -0.5% | +48,756 | |
| 1,701,827 | 92.4% | 1,689,821 | 92.2% | -0.2% | -12,006 | |
| 4,726,306 | 81.9% | 4,719,824 | 81.7% | -0.2% | -6,482 | |
| 494,173 | 84.2% | 492,245 | 84.1% | -0.1% | -1,928 | |
| 197,964,402 | 61.7% | 197,969,608 | 61.3% | -0.3% | +5,206 |
Culture
From their earliest presence in North America, White Americans have contributed literature, art, cinema, religion, agricultural skills, foods, science and technology, fashion and clothing styles, music, language, legal system, political system, and social and technological innovation to American culture. White American culture derived its earliest influences from English, Scottish, Welsh, and Irish settlers and is quantitatively the largest proportion of American culture.[67] The overall American culture reflects White American culture. The culture has been developing since long before the United States formed a separate country. Much of American culture shows influences from English culture. Colonial ties to Great Britain spread the English language, legal system and other cultural attributes.[68]
Albion's Seed: Four British Folkways in America

In his 1989 book Albion's Seed: Four British Folkways in America, David Hackett Fischer explores the details of the folkways of four groups of settlers from the British Isles that came to the American colonies during the 17th and 18th centuries from distinct regions of Britain and Ireland. His thesis is that the culture of each group persisted (albeit in modified form), providing the basis for the modern United States.[69]
According to Fischer, the foundation of America's four regional cultures was formed from four mass migrations from four regions of the British Isles by four distinct ethno-cultural groups. New England's formative period occurred between 1629 and 1640 when Puritans, mostly from East Anglia, settled there, thus forming the basis for the New England regional culture.[70] The next mass migration was of southern English Cavaliers and their working class English servants to the Chesapeake Bay region between 1640 and 1675. This spawned the creation of the American Southern culture.[71]
Then, between 1675 and 1725, thousands of Irish, Cornish, English and Welsh Quakers plus many Germans sympathetic to Quaker ideas, led by William Penn, settled the Delaware Valley. This resulted in the formation of the General American culture, although, according to Fischer, this is really a "regional culture", even if it does today encompass most of the U.S. from the mid-Atlantic states to the Pacific Coast.[72] Finally, a huge number of settlers from the borderlands between England and Scotland, and from northern Ireland, migrated to Appalachia between 1717 and 1775. This resulted in the formation of the Upland South regional culture, which has since expanded to the west to West Texas and parts of the American Southwest.[73]
In his book, Fischer brings up several points. He states that the U.S. is not a country with one "general" culture and several "regional" culture, as is commonly thought. Rather, there are only four regional cultures as described above, and understanding this helps one to more clearly understand American history as well as contemporary American life. Fischer asserts that it is not only important to understand where different groups came from, but when. All population groups have, at different times, their own unique set of beliefs, fears, hopes and prejudices. When different groups came to America and brought certain beliefs and values with them, these ideas became, according to Fischer, more or less frozen in time, even if they eventually changed in their original place of origin.[74]
Admixture
Admixture in Non-Hispanic Whites
Some White Americans have varying amounts of American Indian and Sub-Saharan African ancestry. In a recent study, Gonçalves et al. 2007 reported Sub-Saharan and Amerindian mtDna lineages at a frequency of 3.1% (respectively 0.9% and 2.2%) in American Caucasians (Please note that in the USA, "Caucasian" includes people from North Africa and Western Asia as well as Europeans).[75] Recent research on Y-chromosomes and mtDNA detected no African admixture in European-Americans. The sample included 628 European-American Y-chromosomes and mtDNA from 922 European-Americans[76]
DNA analysis on White Americans by geneticist Mark D. Shriver showed an average of 0.7% Sub-Saharan African admixture and 3.2% Native American admixture.[77] The same author, in another study, claimed that about 30% of all White Americans, approximately 66 million people, have a median of 2.3% of Black African admixture.[78] Shriver discovered his ancestry is 10 percent African, and Shriver's partner in DNA Print Genomics, J.T. Frudacas, contradicted him two years later stating "Five percent of European Americans exhibit some detectable level of African ancestry."[79]
White Americans (European Americans) on average are: 98.6 percent European, 0.19 percent African and 0.18 percent Native American. Inferred British/Irish ancestry is found in European Americans from all states at mean proportions of above 20%, and represents a majority of ancestry, above 50% mean proportion, in states such as Mississippi, Arkansas, and Tennessee. Scandinavian ancestry in European Americans is highly localized; most states show only trace mean proportions of Scandinavian ancestry, while it comprises a significant proportion, upwards of 10%, of ancestry in European Americans from Minnesota and the Dakotas.[80]
Admixture in Hispanic Whites
Although most Hispanic Americans self-identify in the white racial category of the US Census and/or other official government data collecting, an overwhelming majority of them would in their personal lives consider themselves as ethnically mestizo (of mixed European and Amerindian background) or mulatto (of mixed European and sub-Saharan African background).[81]
Thus, only a minority of those Hispanic Americans who self-identified in their personal lives as mestizo or mulatto actually selected "multiracial" as their race on the U.S. census, with 9 out of every 10 of them preferring to pick white, one of the five single race categories available on the U.S. census.[81]
In contrast to non-Hispanic European Americans, whose average European ancestry ranges about 98.6%,[80][82] genetic research has found that the average European admixture among self-identified Hispanic White Americans is 73% European, while the average European admixture for Hispanic Americans overall (regardless of their self-identified race) is 65.1% European admixture.
See also
Notes
References
- 1 2 "Overview of Race and Hispanic Origin: 2010 : 2010 Census Briefs" (PDF). Census.gov. Retrieved 2016-10-22.
- ↑ "B03002 HISPANIC OR LATINO ORIGIN BY RACE - United States - 2017 American Community Survey 1-Year Estimates". U.S. Census Bureau. July 1, 2017. Retrieved October 11, 2018.
- ↑ "B03002 HISPANIC OR LATINO ORIGIN BY RACE - United States - 2017 American Community Survey 1-Year Estimates". U.S. Census Bureau. July 1, 2017. Retrieved October 11, 2018.
- 1 2 Karen R. Humes, Nicholas A. Jones, and Roberto R. Ramirez, eds. (March 2011). "Definition of Race Categories Used in the 2010 Census" (PDF). United States Census Bureau. p. 3. Retrieved September 8, 2013.
- 1 2 "The White Population: 2000" (PDF). United States Census Bureau. August 2001. Retrieved March 10, 2011.
- ↑ Thompson, Derek (August 19, 2008). "Do white people really come from the Caucasus?". Slate. Retrieved March 10, 2011. Caucasians included most Europeans, Northern Africans, and Asians as far east as the Ganges Delta in modern India.
- ↑ Lee, Sandra Soo-Jin; Mountain, Joanna; Koenig, Barbara A. (2001). "The meanings of "race" in the new genomics: Implications for health disparities research" (PDF). Yale Journal of Health Policy, Law, and Ethics. 1: 33–75. PMID 12669320. Archived from the original (PDF) on March 3, 2016.
- 1 2 Dominic Pulera (2004-10-20). Sharing the Dream: White Males in Multicultural America. Books.google.com. p. 57. ISBN 9780826416438. Retrieved 2016-10-22.
- 1 2 Reynolds Farley, 'The New Census Question about Ancestry: What Did It Tell Us?', Demography, Vol. 28, No. 3 (August 1991), pp. 414, 421.
- 1 2 Stanley Lieberson and Lawrence Santi, 'The Use of Nativity Data to Estimate Ethnic Characteristics and Patterns', Social Science Research, Vol. 14, No. 1 (1985), pp. 44-6.
- 1 2 Stanley Lieberson and Mary C. Waters, 'Ethnic Groups in Flux: The Changing Ethnic Responses of American Whites', Annals of the American Academy of Political and Social Science, Vol. 487, No. 79 (September 1986), pp. 82-86.
- ↑ "Census Bureau explores new Middle East/North Africa ethnic category". Pewresearch.org. March 24, 2014. Retrieved November 6, 2017.
- 1 2 Seth Korelitz, "The Menorah Idea: From Religion to Culture, From Race to Ethnicity," American Jewish History 1997 85(1): 75–100. 0164–0178
- 1 2 Peter Novick, The Holocaust in American Life (1999); Hilene Flanzbaum, ed. The Americanization of the Holocaust (1999); Monty Noam Penkower, "Shaping Holocaust Memory," American Jewish History 2000 88(1): 127–132. 0164–0178
- 1 2 Steve Siporin, "Immigrant and Ethnic Family Folklore," Western States Jewish History 1990 22(3): 230–242. 0749–5471
- 1 2 M. Lerner, Village Voice, 1993
- ↑ Bureau, U.S. Census. "American FactFinder - Results". factfinder.census.gov. Retrieved August 29, 2017.
- ↑ Bureau, U.S. Census. "American FactFinder - Search".
- ↑ Sharon R. Ennis; Merarys Ríos-Vargas; Nora G. Albert (May 2011). "U.S. Census Bureau" (PDF). p. 14. Retrieved July 11, 2011.
- ↑ "Archived copy". Archived from the original on March 4, 2010. Retrieved 2010-04-25.
- ↑ "American FactFinder Help". United States Census Bureau. Archived from the original on February 27, 2010. Retrieved November 11, 2008.
Origin can be viewed as the heritage, nationality group, lineage, or country of birth of the person or the person's parents or ancestors before their arrival in the United States. People who identify their origin as Spanish, Hispanic, or Latino may be of any race.
- ↑ "Overview of Race and Hispanic Origin: 2000" (PDF). Census.gov. Retrieved 2016-10-22.
- ↑
- ↑
- ↑ "Not Quite White: Race Classification and the Arab American Experience - Arab American Institute". Aaiusa.org. Retrieved December 14, 2017.
- ↑ "Archived copy". Archived from the original on October 26, 2010. Retrieved 2010-11-05.
- ↑ "Surveillance Epidemiology and End Results. Race and Nationality Descriptions from the 2000 Census and Bureau of Vital Statistics" (PDF). Seer.cancer.gov. May 21, 2007. Retrieved 2016-10-22.
- ↑ "Clark Library | U-M Library". Lib.umich.edu. Retrieved 2016-10-22.
- ↑ Ajrouch, Kristine J. (2016). "Caliber – Sociological Perspectives – 47(4):371 – Abstract". Ucpress.net. 47 (4): 371–391. doi:10.1525/sop.2004.47.4.371.
- 1 2 Armas Kustaa Ensio Holmio, "History of the Finns in Michigan", p. 17
- ↑ Joe R. Feagin, Racist America: roots, current realities, and future reparations, Routledge, 2000, p.77.
- ↑ Eric Dregni, "Vikings in the attic: In search of Nordic America", p. 176
- ↑ John Tehranian, "Performing Whiteness: Naturalization Litigation and the Construction of Racial Identity in America," The Yale Law Journal, Vol. 109, No. 4. (Jan. 2000), pp. 825–827, 847.
- ↑ Roediger, Wages of Whiteness, 186; Tony Horwitz, Confederates in the Attic: Dispatches from the Unfinished Civil War (New York, 1998).
- ↑ Sweet, Frank W. Legal History of the Color Line: The Notion of Invisible Blackness. Backintyme Publishers (2005), ISBN 0-939479-23-0.
- ↑ Delgado, Richard; Stefancic, Jean (March 24, 2018). "Critical Race Theory: The Cutting Edge". Temple University Press – via Google Books.
- ↑ "Treatise" (PDF). files.eric.ed.gov.
- ↑ Crenshaw, Kimberlé (March 24, 1995). "Critical Race Theory: The Key Writings that Formed the Movement". The New Press – via Google Books.
- ↑ "Essay". scholarship.law.umn.edu.
- ↑ Oremus, Will (9 March 2012). "Did Obama Hug a Radical?". Slate. Retrieved 21 June 2017.
- ↑ "Critical Race Theory" (PDF). tijdschriftframe.nl.
- ↑ Seidman, S. (2004). Critical Race Theory. In Contested Knowledge: Social Theory Today (pp. 231–243). Malden, MA: Blackwell Publishing.
- ↑ "Official census statistics of the United States race and Hispanic origin population" (PDF). Census.gov. Archived from the original (PDF) on November 14, 2014.
- ↑ "Census 2000 Summary File 1 (SF 1) 100-Percent Data Geographic Area: United States". Census.gov.
- ↑ "The White Population: 2000" (PDF). Census.gov.
- ↑ "Overview of Race and Hispanic Origin: 2010" (PDF). Census.gov.
- ↑ Grieco, Elizabeth M.; Acosta, Yesenia D.; de la Cruz, G. Patricia; Gambino, Christine; Gryn, Thomas; Larsen, Luke J.; Trevelyan, Edward N.; Walters, Nathan P. (May 2012). "The Foreign-Born Population in the United States: 2010" (PDF). Census.gov. United States Census Bureau. Archived from the original (PDF) on May 11, 2012.
- ↑ Lindsay Hixson; Bradford B. Hepler; Myoung Ouk Kim (September 2011). "The White Population: 2010" (PDF). United States Census Bureau. United States Department of Commerce. Retrieved November 20, 2012.
- ↑ "United States Population Projections By Race and Hispanic Origin: 2000 TO 2050" (PDF). United States Census Bureau. Archived from the original (Excel) on March 6, 2008. Retrieved May 5, 2008.
- ↑ "Ancestry of the Population by State: 1980 - Table 3" (PDF). Census.gov. Retrieved 2016-10-22.
- ↑ Lieberson, Stanley & Waters, Mary C. (1986). "Ethnic Groups in Flux: The Changing Ethnic Responses of American Whites". Annals of the American Academy of Political and Social Science. 487 (79): 82–86. doi:10.1177/0002716286487001004.
- ↑ Fischer, David Hackett (1989). Albion's Seed: Four British Folkways in America. New York: Oxford University Press. pp. 633–639. ISBN 978-0-19-503794-4.
- ↑ "Total fertility rates are lowest among whites and highest among Hispanics". Familyfacts.org.
- ↑ Brewer, Cynthia; Trudy Suchan (2001). Census 2000, The Geography of US Diversity. Redlands, California: ESRI Press.
- ↑ "Distribution of those identifying as White alone, by state, US Census Bureau". Archived from the original on May 5, 2007. Retrieved October 5, 2006.
- ↑ "United States – States; and Puerto Rico: Percent of the Total Population Who Are White Alone 2007". Census.gov.
- ↑ Bureau, U.S. Census. "American FactFinder".
- ↑ "New Study Claims US Jews Have Reasons to Be Proud - News Briefs". Israelnationalnews.com. 2008-06-25. Retrieved 2016-10-22.
- ↑ "Microsoft Word - Cuba Fact Sheet Final Draft 08252006 _3_.doc" (PDF). Pewhispanic.org. Retrieved 2016-10-22.
- ↑ "Income, Poverty, and Health Insurance Coverage in the United States: 2004" (PDF). Census.gov. Retrieved 2016-10-22.
- ↑ "Archived copy". Archived from the original on July 4, 2007. Retrieved 2007-06-05.
- ↑ "US Census Bureau report on educational attainment in the United States, 2003" (PDF). Retrieved December 23, 2006.
- ↑ "US Census Bureau, Personal income forum, Age 25+, 2005". Archived from the original on January 4, 2007. Retrieved January 20, 2007.
- ↑ "kahn3801.dvi" (PDF). Siepr.stanford.edu. Retrieved 2016-10-22.
- ↑ "2010 Demographic Profile. Population by Race, ethnicity, sex/age". Census.gov. Retrieved August 29, 2017.
- 1 2 "Annual Estimates of the Resident Population by Sex, Race, and Hispanic Origin for the United States, States, and Counties: April 1, 2010 to July 1, 2016: 2016 Population Estimates". American FactFinder.
- ↑ "European Influences on Colonial American Culture". pbslearningmedia.org.
- ↑ James B. Minahan (2013-03-14). Ethnic Groups of the Americas: An Encyclopedia: An Encyclopedia. Books.google.com. p. 9. ISBN 9781610691642. Retrieved 2016-10-22.
- ↑ David Hackett Fischer, Albion's Seed (Oxford University Press, 1989), p. 6
- ↑ Fischer, Albion's Seed, pp. 13–206
- ↑ Fischer, Albion's Seed pp. 207–418
- ↑ Fischer, Albion's Seed, pp. 419–604
- ↑ Fischer, Albion's Seed, pp. 605–782
- ↑ Hackett Fischer, David. Albion's Seed Oxford University Press, 1989.
- ↑ Sample of 1387 American Caucasian individuals catalogued in the FBI mtDNA population database, Gonçalves et al. 2007, Sex-biased gene flow in African Americans but not in American Caucasians
- ↑ Manfred Kayser et al. 2003, Y Chromosome STR Haplotypes and the Genetic Structure of U.S. Populations of African, European, and Hispanic Ancestry
- ↑ Shriver, et al., "Skin pigmentation, biogeographical ancestry and admixture mapping Archived December 30, 2014, at the Wayback Machine., Hum Genet (2003) 112 : 387–39.
- ↑ Sailer, Steve (May 8, 2002). "Analysis: White prof finds he's not". UPI.
- ↑ Jim Wooten, "Race Reversal Man Lives as ‘Black’ for 50 Years — Then Finds Out He’s Probably Not, ABC News (2004).
- 1 2 Bryc, Katarzyna et al. "The genetic ancestry of African, Latino, and European Americans across the United States" 23andme. pp. 22, 38 doi:10.1101/009340. "Supplemental Tables and Figures". p. 42. September 18, 2014. Retrieved July 16, 2015.
- 1 2 González-Barrera, Ana. "'Mestizo' and 'mulatto': Mixed-race identities among U.S. Hispanics". Pew Research Center. Archived from the original on July 16, 2015. Retrieved July 16, 2015.
- ↑ Zimmer, Carl (December 24, 2014). "White? Black? A Murky Distinction Grows Still Murkie". The New York Times. Retrieved October 24, 2015.
External links
- White Population 2000 from the US Census
| |||||||||||
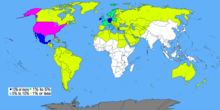
| Worldwide diaspora |
| ||||||||||
| Historical concepts | |||||||||||
| Sociological phenomena and theories | |||||||||||
| White American caricatures and stereotypes | |||||||||||
| Identity politics in the United States | |||||||||||
| Scientific racism | |||||||||||