Lafayette County, Wisconsin
| Lafayette County, Wisconsin | |
|---|---|
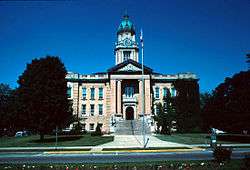 Lafayette County Courthouse in 1982 | |
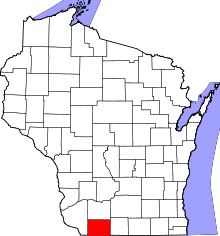 Location in the U.S. state of Wisconsin | |
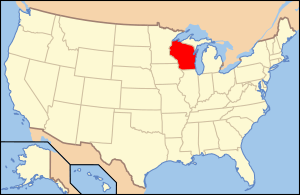 Wisconsin's location in the U.S. | |
| Founded | 1846 |
| Named for | Marquis de Lafayette |
| Seat | Darlington |
| Largest city | Darlington |
| Area | |
| • Total | 635 sq mi (1,645 km2) |
| • Land | 634 sq mi (1,642 km2) |
| • Water | 1.0 sq mi (3 km2), 0.2% |
| Population | |
| • (2010) | 16,836 |
| • Density | 27/sq mi (10/km2) |
| Congressional district | 2nd |
| Time zone | Central: UTC−6/−5 |
| Website |
www |
Lafayette County, sometimes spelled La Fayette County, is a county located in the U.S. state of Wisconsin. It was part of the Wisconsin Territory at the time of its founding. As of the 2010 census, the population was 16,836.[1] Its county seat is Darlington.[2] The county was named in honor of the Marquis de Lafayette, the French general who rendered assistance to the Continental Army in the American Revolutionary War.[3]
Geography
According to the U.S. Census Bureau, the county has a total area of 635 square miles (1,640 km2), of which 634 square miles (1,640 km2) is land and 1.0 square mile (2.6 km2) (0.2%) is water.[4]
Major highways
Adjacent counties
- Grant County - west
- Iowa County - north
- Green County - east
- Stephenson County, Illinois - southeast
- Jo Daviess County, Illinois - south
Demographics
| Historical population | |||
|---|---|---|---|
| Census | Pop. | %± | |
| 1850 | 11,531 | — | |
| 1860 | 18,134 | 57.3% | |
| 1870 | 22,659 | 25.0% | |
| 1880 | 21,279 | −6.1% | |
| 1890 | 20,265 | −4.8% | |
| 1900 | 20,959 | 3.4% | |
| 1910 | 20,075 | −4.2% | |
| 1920 | 20,002 | −0.4% | |
| 1930 | 18,649 | −6.8% | |
| 1940 | 18,695 | 0.2% | |
| 1950 | 18,137 | −3.0% | |
| 1960 | 18,142 | 0.0% | |
| 1970 | 17,456 | −3.8% | |
| 1980 | 17,412 | −0.3% | |
| 1990 | 16,076 | −7.7% | |
| 2000 | 16,137 | 0.4% | |
| 2010 | 16,836 | 4.3% | |
| Est. 2016 | 16,753 | [5] | −0.5% |
| U.S. Decennial Census[6] 1790–1960[7] 1900–1990[8] 1990–2000[9] 2010–2014[1] | |||
As of the census of 2000,[10] there were 16,137 people, 6,211 households, and 4,378 families residing in the county. The population density was 26 people per square mile (10/km²). There were 6,674 housing units at an average density of 10 per square mile (4/km²). The racial makeup of the county was 99.03% White, 0.11% Black or African American, 0.11% Native American, 0.22% Asian, 0.04% Pacific Islander, 0.14% from other races, and 0.35% from two or more races. 0.57% of the population were Hispanic or Latino of any race. 33.8% were of German, 17.5% Norwegian, 13.6% Irish, 11.9% English, 6.8% Swiss and 6.0% American ancestry.
There were 6,211 households out of which 33.30% had children under the age of 18 living with them, 59.00% were married couples living together, 7.60% had a female householder with no husband present, and 29.50% were non-families. 25.40% of all households were made up of individuals and 13.10% had someone living alone who was 65 years of age or older. The average household size was 2.57 and the average family size was 3.10.
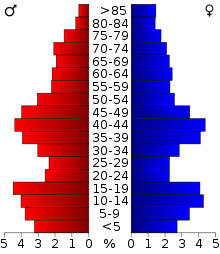
In the county, the population was spread out with 27.20% under the age of 18, 7.60% from 18 to 24, 27.20% from 25 to 44, 22.10% from 45 to 64, and 15.80% who were 65 years of age or older. The median age was 38 years. For every 100 females there were 99.80 males. For every 100 females age 18 and over, there were 98.00 males.
Communities
Cities
- Cuba City (mostly in Grant County)
- Darlington (county seat)
- Shullsburg
Villages
- Argyle
- Belmont
- Benton
- Blanchardville (partly in Iowa County)
- Gratiot
- Hazel Green (mostly in Grant County)
- South Wayne
Towns
Census-designated places
Other unincorporated communities
Politics
| Year | Republican | Democratic | Third parties |
|---|---|---|---|
| 2016 | 51.9% 3,977 | 42.9% 3,288 | 5.2% 397 |
| 2012 | 41.7% 3,314 | 57.0% 4,536 | 1.3% 102 |
| 2008 | 38.1% 2,984 | 60.4% 4,732 | 1.5% 115 |
| 2004 | 46.8% 3,929 | 52.5% 4,402 | 0.7% 57 |
| 2000 | 45.9% 3,336 | 51.1% 3,710 | 3.0% 217 |
| 1996 | 33.6% 2,172 | 50.5% 3,261 | 15.9% 1,027 |
| 1992 | 32.9% 2,582 | 40.0% 3,143 | 27.2% 2,134 |
| 1988 | 50.7% 3,665 | 48.7% 3,521 | 0.6% 44 |
| 1984 | 60.4% 4,584 | 39.0% 2,961 | 0.5% 41 |
| 1980 | 51.5% 4,421 | 41.9% 3,598 | 6.7% 572 |
| 1976 | 50.5% 4,131 | 46.9% 3,839 | 2.6% 213 |
| 1972 | 62.9% 4,898 | 36.0% 2,804 | 1.1% 84 |
| 1968 | 55.1% 4,084 | 38.5% 2,853 | 6.4% 475 |
| 1964 | 41.6% 3,194 | 58.3% 4,471 | 0.1% 6 |
| 1960 | 56.6% 4,715 | 43.3% 3,607 | 0.1% 8 |
| 1956 | 59.3% 4,733 | 40.3% 3,212 | 0.4% 33 |
| 1952 | 66.2% 5,731 | 33.6% 2,905 | 0.2% 17 |
| 1948 | 46.3% 3,288 | 52.7% 3,740 | 1.1% 76 |
| 1944 | 54.3% 4,421 | 45.4% 3,696 | 0.4% 30 |
| 1940 | 53.7% 5,059 | 45.8% 4,315 | 0.5% 45 |
| 1936 | 41.1% 3,801 | 53.8% 4,976 | 5.1% 470 |
| 1932 | 39.5% 3,246 | 59.5% 4,886 | 1.0% 81 |
| 1928 | 58.5% 5,134 | 40.9% 3,585 | 0.6% 52 |
| 1924 | 34.7% 2,671 | 16.4% 1,265 | 48.9% 3,763 |
| 1920 | 76.1% 4,893 | 21.1% 1,357 | 2.8% 179 |
| 1916 | 54.1% 2,544 | 43.8% 2,059 | 2.2% 102 |
| 1912 | 39.1% 1,747 | 41.5% 1,852 | 19.4% 864 |
| 1908 | 56.0% 2,832 | 41.5% 2,100 | 2.6% 129 |
| 1904 | 58.2% 2,875 | 39.0% 1,928 | 2.8% 138 |
| 1900 | 55.8% 2,852 | 41.1% 2,100 | 3.1% 156 |
| 1896 | 54.7% 2,919 | 41.9% 2,236 | 3.3% 177 |
| 1892 | 47.9% 2,366 | 46.3% 2,286 | 5.9% 291 |
See also
References
- 1 2 "State & County QuickFacts". United States Census Bureau. Archived from the original on July 13, 2011. Retrieved January 21, 2014.
- ↑ "Find a County". National Association of Counties. Retrieved 2011-06-07.
- ↑ Gannett, Henry (1905). The Origin of Certain Place Names in the United States. Government Printing Office. p. 178.
- ↑ "2010 Census Gazetteer Files". United States Census Bureau. August 22, 2012. Retrieved August 5, 2015.
- ↑ "Population and Housing Unit Estimates". Retrieved June 9, 2017.
- ↑ "U.S. Decennial Census". United States Census Bureau. Retrieved August 5, 2015.
- ↑ "Historical Census Browser". University of Virginia Library. Retrieved August 5, 2015.
- ↑ Forstall, Richard L., ed. (March 27, 1995). "Population of Counties by Decennial Census: 1900 to 1990". United States Census Bureau. Retrieved August 5, 2015.
- ↑ "Census 2000 PHC-T-4. Ranking Tables for Counties: 1990 and 2000" (PDF). United States Census Bureau. April 2, 2001. Retrieved August 5, 2015.
- ↑ "American FactFinder". United States Census Bureau. Retrieved 2011-05-14.
- ↑ Leip, David. "Dave Leip's Atlas of U.S. Presidential Elections". uselectionatlas.org. Retrieved 11 April 2018.
Further reading
- Commemorative Biographical Record of the Counties of Rock, Green, Grant, Iowa, and Lafayette, Wisconsin, Containing Biographical Sketches of Prominent and Representative Citizens, and of Many of the Early Settled Families. Chicago: J. H. Beers and Co., 1901.
- History of La Fayette County, Wisconsin. Chicago: Western Historical Company, 1881.
External links
| Wikimedia Commons has media related to Lafayette County, Wisconsin. |
- Lafayette County government website
- Lafayette County map from the Wisconsin Department of Transportation
- Lafayette Development Corporation
Places adjacent to Lafayette County, Wisconsin | ||||||||||
|---|---|---|---|---|---|---|---|---|---|---|
| ||||||||||
Municipalities and communities of Lafayette County, Wisconsin, United States | ||
|---|---|---|
| Cities | | |
| Villages | ||
| Towns | ||
| CDP | ||
| Unincorporated communities | ||
| Footnotes | ‡This populated place also has portions in an adjacent county or counties | |