Kenosha County, Wisconsin
| Kenosha County, Wisconsin | |
|---|---|
 | |
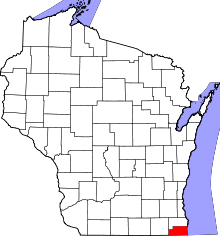 Location in the U.S. state of Wisconsin | |
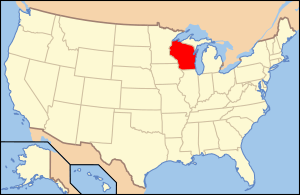 Wisconsin's location in the U.S. | |
| Founded | 1850 |
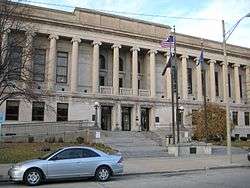
| Seat | Kenosha |
| Largest city | Kenosha |
| Area | |
| • Total | 754 sq mi (1,953 km2) |
| • Land | 272 sq mi (704 km2) |
| • Water | 482 sq mi (1,248 km2), 64% |
| Population | |
| • ([[2010 United States Census|2010]]) | 166,426 |
| • Density | 612/sq mi (236/km2) |
| Congressional district | 1st |
| Time zone | Central: UTC−6/−5 |
| Website |
www |
Kenosha County is a county in the southeastern corner of the U.S. state of Wisconsin. Its population in 2017 was estimated to be 168,065, making it the eighth most populous county in Wisconsin.[1] The county is named after the county seat, Kenosha,[2] the fourth largest city in Wisconsin.[1]
Kenosha County is part of the Chicago-Joliet-Naperville, IL-IN-WI Metropolitan Statistical Area. It is on the west shore of Lake Michigan. The county has traditionally attracted newcomers from suburban Chicago, and in March 2008 the demographers of the Wisconsin Department of Administration reported that Kenosha County's improvements in roads, business's need for personnel, and quality-of-life factors had contributed to a decades-long influx of Illinois transplants, along with the direct rail link to Chicago via Metra's Union Pacific / North Line.
History
The Potowatomi inhabited the area that would become Kenosha County for centuries prior to the acquisition of the area in 1833. The city of Kenosha was founded in 1835, and Kenosha County was formed from Racine County in 1850. Its location led to development and factories being built in the 19th century. Manufacturing continued to be a key component of the economy into the 20th century.[3]
Geography
According to the U.S. Census Bureau, the county has a total area of 754 square miles (1,950 km2), of which 272 square miles (700 km2) is land and 482 square miles (1,250 km2) (64%) is water.[4] Although the county contains area from Lake Michigan, it is the fourth-smallest county in Wisconsin by land area.
Major highways
Airport
Kenosha Regional Airport (KENW) serves the county and surrounding communities.
Adjacent counties
- Racine County (north)
- Allegan County, Michigan (east)
- Lake County, Illinois (southeast)
- McHenry County, Illinois (southwest)
- Walworth County (west)
Demographics
| Historical population | |||
|---|---|---|---|
| Census | Pop. | %± | |
| 1850 | 10,734 | — | |
| 1860 | 13,900 | 29.5% | |
| 1870 | 13,147 | −5.4% | |
| 1880 | 13,550 | 3.1% | |
| 1890 | 15,581 | 15.0% | |
| 1900 | 21,707 | 39.3% | |
| 1910 | 32,929 | 51.7% | |
| 1920 | 51,284 | 55.7% | |
| 1930 | 63,277 | 23.4% | |
| 1940 | 63,505 | 0.4% | |
| 1950 | 75,238 | 18.5% | |
| 1960 | 100,615 | 33.7% | |
| 1970 | 117,917 | 17.2% | |
| 1980 | 123,137 | 4.4% | |
| 1990 | 128,181 | 4.1% | |
| 2000 | 149,577 | 16.7% | |
| 2010 | 166,426 | 11.3% | |
| Est. 2016 | 168,183 | [5] | 1.1% |
| U.S. Decennial Census[6] 1790–1960[7] 1900–1990[8] 1990–2000[9] 2010–2014[10] | |||
As of the census[11] of 2000, there were 149,577 people, 56,057 households, and 38,455 families residing in the county. The population density was 548 people per square mile (212/km²). There were 59,989 housing units at an average density of 220 per square mile (85/km²). The racial makeup of the county was 88.38% White, 5.08% Black or African American, 0.38% Native American, 0.92% Asian, 0.04% Pacific Islander, 3.29% from other races, and 1.91% from two or more races. 7.19% of the population were Hispanic or Latino of any race. 28.8% were of German, 10.4% Italian, 7.9% Irish, 7.6% Polish and 7.5% English ancestry according to Census 2000.
There were 56,057 households out of which 34.80% had children under the age of 18 living with them, 52.70% were married couples living together, 11.50% had a female householder with no husband present, and 31.40% were non-families. 25.50% of all households were made up of individuals and 9.10% had someone living alone who was 65 years of age or older. The average household size was 2.60 and the average family size was 3.13.
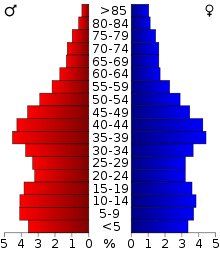
In the county, the population was spread out with 27.10% under the age of 18, 9.40% from 18 to 24, 31.30% from 25 to 44, 20.70% from 45 to 64, and 11.50% who were 65 years of age or older. The median age was 35 years. For every 100 females, there were 98.30 males. For every 100 females age 18 and over, there were 95.30 males.
Government
The county legislature is known as the Board of Supervisors. It consists of 23 members, each elected from single-member districts. The county executive is elected in a spring countywide, nonpartisan vote. The county executive is James Kreuser. The district attorney, treasurer, clerk, and register of deeds are elected in fall countywide, partisan elections held in presidential years, while the sheriff and clerk of circuit court are elected in fall countywide, partisan elections held in gubernatorial years.
Politics
In presidential elections, Kenosha County has voted Democratic for most of the past 50 years. In 2016, Donald Trump became the first Republican presidential candidate in 44 years to win the county; the last time this happened was when President Nixon carried it in his 1972 landslide.
| Year | Republican | Democratic | Third parties |
|---|---|---|---|
| 2016 | 47.2% 36,037 | 46.9% 35,799 | 5.9% 4,468 |
| 2012 | 43.2% 34,977 | 55.5% 44,867 | 1.3% 1,053 |
| 2008 | 40.1% 31,609 | 58.2% 45,836 | 1.7% 1,344 |
| 2004 | 46.6% 35,587 | 52.5% 40,107 | 1.0% 734 |
| 2000 | 45.4% 28,891 | 50.9% 32,429 | 3.8% 2,389 |
| 1996 | 34.1% 18,296 | 52.1% 27,964 | 13.9% 7,457 |
| 1992 | 32.1% 19,854 | 44.2% 27,341 | 23.7% 14,642 |
| 1988 | 41.6% 21,661 | 57.7% 30,089 | 0.7% 379 |
| 1984 | 46.9% 26,118 | 52.5% 29,233 | 0.6% 344 |
| 1980 | 43.8% 24,481 | 47.9% 26,738 | 8.3% 4,644 |
| 1976 | 43.6% 22,349 | 53.8% 27,585 | 2.6% 1,316 |
| 1972 | 53.9% 24,041 | 43.6% 19,441 | 2.5% 1,094 |
| 1968 | 40.6% 17,089 | 50.9% 21,427 | 8.6% 3,610 |
| 1964 | 32.6% 14,764 | 67.3% 30,522 | 0.2% 70 |
| 1960 | 46.4% 19,969 | 53.4% 22,956 | 0.2% 86 |
| 1956 | 55.1% 21,367 | 44.1% 17,094 | 0.9% 335 |
| 1952 | 48.7% 18,917 | 50.9% 19,768 | 0.4% 142 |
| 1948 | 39.8% 12,780 | 56.0% 17,987 | 4.2% 1,342 |
| 1944 | 40.0% 12,436 | 58.9% 18,325 | 1.2% 360 |
| 1940 | 40.9% 12,182 | 57.7% 17,174 | 1.4% 421 |
| 1936 | 26.7% 7,268 | 66.6% 18,137 | 6.8% 1,840 |
| 1932 | 30.6% 7,307 | 60.1% 14,373 | 9.3% 2,223 |
| 1928 | 50.7% 11,330 | 47.6% 10,638 | 1.8% 395 |
| 1924 | 55.5% 10,341 | 8.1% 1,517 | 36.4% 6,791 |
| 1920 | 77.8% 9,791 | 13.7% 1,724 | 8.5% 1,069 |
| 1916 | 51.0% 3,537 | 40.6% 2,813 | 8.5% 587 |
| 1912 | 27.2% 1,671 | 36.1% 2,216 | 36.7% 2,254[13] |
| 1908 | 54.5% 3,409 | 32.1% 2,006 | 13.4% 840 |
| 1904 | 60.9% 3,293 | 29.4% 1,592 | 9.7% 526 |
| 1900 | 58.4% 3,078 | 39.8% 2,101 | 1.8% 94 |
| 1896 | 60.5% 2,827 | 37.1% 1,732 | 2.4% 111 |
| 1892 | 44.7% 1,628 | 53.0% 1,928 | 2.3% 85 |
Communities
City
- Kenosha (county seat)
Villages
Towns
Census-designated places
Unincorporated communities
Ghost towns/neighborhoods
See also
References
- 1 2 "Archived copy" (PDF). Archived (PDF) from the original on 2018-05-04. Retrieved 2018-03-25.
- ↑ "Here's How Iron Got Its Name". The Rhinelander Daily News. June 16, 1932. p. 2. Archived from the original on September 3, 2014. Retrieved August 24, 2014 – via Newspapers.com.

- ↑ WHS Library Archives Staff. "A Brief History of Kenosha, Wisconsin". Wisconsin Historical Society. Archived from the original on 25 March 2018. Retrieved 25 March 2018.
- ↑ "2010 Census Gazetteer Files". United States Census Bureau. August 22, 2012. Archived from the original on September 4, 2015. Retrieved August 5, 2015.
- ↑ "Population and Housing Unit Estimates". Archived from the original on May 29, 2017. Retrieved June 9, 2017.
- ↑ "U.S. Decennial Census". United States Census Bureau. Archived from the original on May 12, 2015. Retrieved August 5, 2015.
- ↑ "Historical Census Browser". University of Virginia Library. Archived from the original on August 16, 2012. Retrieved August 5, 2015.
- ↑ Forstall, Richard L., ed. (March 27, 1995). "Population of Counties by Decennial Census: 1900 to 1990". United States Census Bureau. Archived from the original on July 18, 2015. Retrieved August 5, 2015.
- ↑ "Census 2000 PHC-T-4. Ranking Tables for Counties: 1990 and 2000" (PDF). United States Census Bureau. April 2, 2001. Archived (PDF) from the original on December 18, 2014. Retrieved August 5, 2015.
- ↑ "State & County QuickFacts". United States Census Bureau. Archived from the original on July 13, 2011. Retrieved January 21, 2014.
- ↑ "American FactFinder". United States Census Bureau. Archived from the original on 2013-09-11. Retrieved 2011-05-14.
- ↑ Leip, David. "Dave Leip's Atlas of U.S. Presidential Elections". uselectionatlas.org. Archived from the original on 23 March 2018. Retrieved 4 May 2018.
- ↑ The leading "other" candidate, Progressive Theodore Roosevelt, received 1,649 votes, while Socialist candidate Eugene Debs received 492 votes, Prohibition candidate Eugene Chafin received 104 votes, and Independent candidate Arthur Reimer received 9 votes.
- Forstall, Richard L. (editor) (1996). Population of states and counties of the United States: 1790 to 1990 : from the twenty-one decennial censuses. United States Department of Commerce, Bureau of the Census, Population Division. ISBN 0-934213-48-8.
External links
- Kenosha County government website
- Kenosha County map from the Wisconsin Department of Transportation
Places adjacent to Kenosha County, Wisconsin | |
|---|---|
Municipalities and communities of Kenosha County, Wisconsin, United States | ||
|---|---|---|
| City | | |
| Villages | ||
| Towns | ||
| CDPs | ||
| Unincorporated communities | ||
| Ghost town/neighborhood | ||
| Footnotes | ‡This populated place also has portions in an adjacent county or counties | |
| Major city | 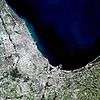 | |
|---|---|---|
| Cities (over 30,000 in 2010) | ||
| Towns and villages (over 30,000 in 2010) |
| |
| Counties | ||
| Regions | ||
| Sub-regions | ||