Lee County, Iowa
| Lee County, Iowa | |
|---|---|
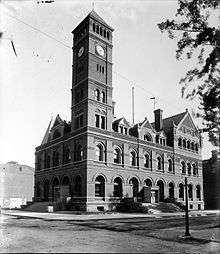
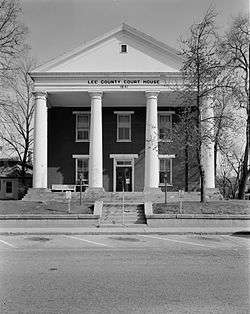 Courthouse located in Fort Madison | |
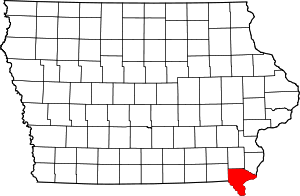 Location in the U.S. state of Iowa | |
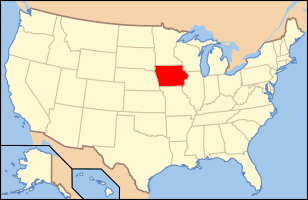 Iowa's location in the U.S. | |
| Founded | 1836 |
| Seat | Fort Madison and Keokuk |
| Largest city | Fort Madison |
| Area | |
| • Total | 539 sq mi (1,396 km2) |
| • Land | 518 sq mi (1,342 km2) |
| • Water | 21 sq mi (54 km2), 4.0% |
| Population | |
| • (2010) | 35,862 |
| • Density | 69/sq mi (27/km2) |
| Congressional district | 2nd |
| Time zone | Central: UTC−6/−5 |
| Website |
www |
Lee County, Iowa, was established in 1836. As of the 2010 census, the population was 35,862.[1] It has two county seats — Fort Madison and Keokuk. Lee County is part of the Fort Madison–Keokuk, IA-IL-MO Micropolitan Statistical Area.
History
Fort Madison dates to the War of 1812. Lee County was the location of the Half-Breed Tract, established by treaty in 1824. Allocations of land were made to American Indian descendants of European fathers and Indian mothers at this tract. Originally the land was to be held in common. Some who had an allocation lived in cities, where they hoped to make better livings.
Lee County as a named entity was formed on December 7, 1836, under the jurisdiction of Wisconsin Territory. It would become a part of Iowa Territory when it was formed on July 4, 1838.[2] Large-scale European-American settlement in the area began in 1839, after Congress allowed owners to sell land individually. Members of the Church of Christ (Latter Day Saints) fled persecutions in Missouri to settle in Illinois and Iowa. Nauvoo, across the border in Hancock County, Illinois, became the main center of Latter-day Saints settlement, but there was also a Latter Day Saints stake organized in Lee County under the direction of John Smith, the uncle of Joseph Smith, land that was sold to them by Isaac Galland in 1839.
Lee has two county seats — Fort Madison and Keokuk.[3] The latter was established in 1847 when disagreements led to a second court jurisdiction.[4]
Lee County's population grew to about 19,000 in 1850, the first US census, to 37,000 per the 3rd census in 1870, peaking at 44,000 people in 1960. It has continuously decreased since and as of 2010, 35,862 people lived there, comparable to the years between 1860 and 1870.[5]
Name
There is no agreement about the derivation of the name "Lee." It has been variously proposed that the county was named for Marsh, Delevan & Lee, of Albany, New York, and the 'New York Land Company', who owned extensive interests in the Half-Breed Tract in the 1830s; Robert E. Lee, who surveyed the Des Moines Rapids; or Albert Lea, who helped explore the interior of Iowa.[6][7]:398
Geography
According to the U.S. Census Bureau, the county has a total area of 539 square miles (1,400 km2), of which 518 square miles (1,340 km2) is land and 21 square miles (54 km2) (4.0%) is water.[8] The lowest point in the state of Iowa is located on the Mississippi River in Keokuk in Lee County, where it flows out of Iowa and into Missouri and Illinois.
Major highways
Adjacent counties
Lee County is surrounded by Henry County to the north, Des Moines County to the northeast, Henderson County, Illinois, across the river east, Hancock County, Illinois to the southeast, Clark County, Missouri in the southwest and Van Buren County, Iowa in the west.
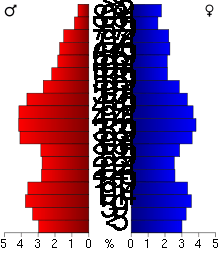
Demographics
| Historical population | |||
|---|---|---|---|
| Census | Pop. | %± | |
| 1850 | 18,861 | — | |
| 1860 | 29,565 | 56.8% | |
| 1870 | 37,210 | 25.9% | |
| 1880 | 34,859 | −6.3% | |
| 1890 | 37,715 | 8.2% | |
| 1900 | 39,719 | 5.3% | |
| 1910 | 36,702 | −7.6% | |
| 1920 | 39,676 | 8.1% | |
| 1930 | 41,268 | 4.0% | |
| 1940 | 41,074 | −0.5% | |
| 1950 | 43,102 | 4.9% | |
| 1960 | 44,207 | 2.6% | |
| 1970 | 42,996 | −2.7% | |
| 1980 | 43,106 | 0.3% | |
| 1990 | 38,687 | −10.3% | |
| 2000 | 38,052 | −1.6% | |
| 2010 | 35,862 | −5.8% | |
| Est. 2016 | 34,615 | [9] | −3.5% |
| U.S. Decennial Census[5] 1790-1960[10] 1900-1990[11] 1990-2000[12] 2010-2013[1] | |||
2000 census
As of the census[13] of 2000, there were 38,052 people, 15,161 households, and 10,248 families residing in the county. The population density was 74 people per square mile (28/km²). There were 16,612 housing units at an average density of 32 per square mile (12/km²). The racial makeup of the county was 94.24% White, 2.80% Black or African American, 0.26% Native American, 0.39% Asian, 0.06% Pacific Islander, 1.03% from other races, and 1.21% from two or more races. 2.37% of the population were Hispanic or Latino of any race.
There were 15,161 households out of which 30.40% had children under the age of 18 living with them, 53.70% were married couples living together, 10.30% had a female householder with no husband present, and 32.40% were non-families. 28.30% of all households were made up of individuals and 13.50% had someone living alone who was 65 years of age or older. The average household size was 2.41 and the average family size was 2.93.
In the county, the population was spread out with 24.40% under the age of 18, 7.80% from 18 to 24, 26.70% from 25 to 44, 24.60% from 45 to 64, and 16.50% who were 65 years of age or older. The median age was 40 years. For every 100 females, there were 97.90 males. For every 100 females age 18 and over, there were 96.40 males.
The median income for a household in the county was $36,193, and the median income for a family was $42,658. Males had a median income of $32,286 versus $21,821 for females. The per capita income for the county was $18,430. About 7.10% of families and 9.70% of the population were below the poverty line, including 12.60% of those under age 18 and 9.60% of those age 65 or over.
2010 census
The 2010 census recorded a population of 35,862 with a population density of 69.3133/sq mi (26.7620/km2). There were 16,205 housing units, of which only 14,610 were occupied.[14]
Communities
Cities
Census-designated place
Other unincorporated communities
Townships
Population ranking
The population ranking of the following table is based on the 2010 census of Lee County.[15]
† county seat
| Rank | City/town/etc. | Municipal type | Population (2010 Census)
|
|---|---|---|---|
| 1 | † Fort Madison | City | 11,051 |
| 2 | † Keokuk | City | 10,780 |
| 3 | West Point | City | 966 |
| 4 | Donnellson | City | 912 |
| 5 | Montrose | City | 898 |
| 6 | Denmark | CDP | 423 |
| 7 | Houghton | City | 146 |
| 8 | Franklin | City | 143 |
| 9 | St. Paul | City | 129 |
Notable people
- Cleng Peerson (1783–1865), pioneer settler in Lee County in 1840[16]
- Richard Proenneke (1916–2003), naturalist, subject of books and documentary[17]
- William Elliott Whitmore (born 1978), singer and songwriter
Politics
| Year | Republican | Democratic | Third parties |
|---|---|---|---|
| 2016 | 54.5% 8,803 | 38.5% 6,215 | 7.0% 1,133 |
| 2012 | 41.2% 7,785 | 56.7% 10,714 | 2.2% 412 |
| 2008 | 41.0% 7,062 | 57.0% 9,821 | 2.0% 347 |
| 2004 | 41.8% 7,472 | 56.9% 10,152 | 1.3% 234 |
| 2000 | 38.3% 6,339 | 58.1% 9,632 | 3.6% 601 |
| 1996 | 31.5% 4,932 | 56.4% 8,831 | 12.1% 1,899 |
| 1992 | 27.9% 4,777 | 54.6% 9,366 | 17.5% 3,009 |
| 1988 | 36.0% 6,228 | 63.1% 10,911 | 0.9% 151 |
| 1984 | 49.2% 8,756 | 50.0% 8,912 | 0.8% 141 |
| 1980 | 48.1% 8,793 | 44.9% 8,204 | 6.9% 1,268 |
| 1976 | 46.9% 8,195 | 51.6% 9,017 | 1.5% 253 |
| 1972 | 55.3% 9,748 | 42.6% 7,510 | 2.0% 360 |
| 1968 | 49.3% 8,883 | 44.8% 8,076 | 6.0% 1,077 |
| 1964 | 34.0% 6,321 | 65.9% 12,244 | 0.1% 17 |
| 1960 | 52.0% 10,765 | 48.0% 9,936 | 0.0% 0 |
| 1956 | 58.4% 11,571 | 41.5% 8,226 | 0.2% 32 |
| 1952 | 58.6% 12,289 | 41.1% 8,625 | 0.3% 55 |
| 1948 | 45.3% 7,801 | 53.5% 9,201 | 1.2% 210 |
| 1944 | 53.0% 9,406 | 46.5% 8,252 | 0.4% 78 |
| 1940 | 53.7% 10,616 | 46.1% 9,117 | 0.2% 33 |
| 1936 | 46.4% 8,955 | 49.9% 9,630 | 3.8% 732 |
| 1932 | 39.6% 7,084 | 59.4% 10,624 | 1.1% 194 |
| 1928 | 59.9% 11,645 | 40.0% 7,785 | 0.1% 25 |
| 1924 | 54.4% 9,999 | 26.7% 4,903 | 18.9% 3,475 |
| 1920 | 65.9% 10,763 | 31.7% 5,177 | 2.4% 383 |
| 1916 | 51.2% 4,395 | 46.5% 3,993 | 2.3% 199 |
| 1912 | 23.7% 2,016 | 45.7% 3,891 | 30.7% 2,613 |
| 1908 | 46.6% 4,262 | 51.5% 4,706 | 1.9% 176 |
| 1904 | 52.7% 4,612 | 44.0% 3,848 | 3.3% 289 |
| 1900 | 45.9% 4,486 | 53.0% 5,182 | 1.1% 110 |
| 1896 | 47.7% 4,847 | 50.7% 5,153 | 1.6% 162 |
See also
- National Register of Historic Places listings in Lee County, Iowa
- Lee County Courthouse in use in Fort Madison, original and oldest courthouse
- Lee County Courthouse in use in Keokuk, originally a Federal courthouse and post office
References
- 1 2 "State & County QuickFacts". United States Census Bureau. Archived from the original on July 13, 2011. Retrieved July 18, 2014.
- ↑ "WI: Individual County Chronologies". publications.newberry.org. Retrieved 2016-09-28.
- ↑ "Find a County". National Association of Counties. Retrieved May 21, 2018.
- ↑ North Lee County Historical Society, Museums USA, accessed 11 Aug 2008
- 1 2 "U.S. Decennial Census". United States Census Bureau. Retrieved July 18, 2014.
- ↑ The History of Lee County, Iowa. Chicago: Western Historical. 1879. pp. 414–415.
- ↑ Naming of Iowa Counties. The Annals of Iowa. 36 (1962), 395-400. ISSN 0003-4827
- ↑ "US Gazetteer files: 2010, 2000, and 1990". United States Census Bureau. 2011-02-12. Retrieved 2011-04-23.
- ↑ "Population and Housing Unit Estimates". Retrieved June 9, 2017.
- ↑ "Historical Census Browser". University of Virginia Library. Retrieved July 18, 2014.
- ↑ "Population of Counties by Decennial Census: 1900 to 1990". United States Census Bureau. Retrieved July 18, 2014.
- ↑ "Census 2000 PHC-T-4. Ranking Tables for Counties: 1990 and 2000" (PDF). United States Census Bureau. Retrieved July 18, 2014.
- ↑ "American FactFinder". United States Census Bureau. Retrieved 2008-01-31.
- ↑ "Population & Housing Occupancy Status 2010". United States Census Bureau American FactFinder. Retrieved May 19, 2011.
- ↑ "Archived copy". Archived from the original on 2013-12-21. Retrieved 2016-07-10.
- ↑ Swansen, H.F. "The Sugar Creek Settlement in Iowa". Norwegian-American Historical Association. pp. Volume IX: Page 38. Retrieved May 21, 2011.
- ↑ "Alone In The Wilderness". Bob Swerer Productions. Retrieved May 21, 2011.
- ↑ Leip, David. "Dave Leip's Atlas of U.S. Presidential Elections". uselectionatlas.org. Retrieved 2018-04-26.
External links
Places adjacent to Lee County, Iowa | |
|---|---|
Municipalities and communities of Lee County, Iowa, United States | ||
|---|---|---|
| Cities | | |
| Townships | ||
| CDP | ||
| Other unincorporated communities | ||
Coordinates: 40°38′34″N 91°28′28″W / 40.64278°N 91.47444°W