Population pyramid

A population pyramid, also called an "age-sex pyramid", is a graphical illustration that shows the distribution of various age groups in a population (typically that of a country or region of the world), which forms the shape of a pyramid when the population is growing.[1] Males are conventionally shown on the left and females on the right, and they may be measured by raw number or as a percentage of the total population. This tool can be used to visualize and age of a particular population.[2] It is also used in ecology to determine the overall age distribution of a population; an indication of the reproductive capabilities and likelihood of the continuation of a species.
Structure
Population pyramids often contain continuous stacked-histogram bars, making it a horizontal bar diagram. The population size is depicted on the x-axis (horizontal) while the age-groups are represented on the y-axis (vertical).[3] The size of the population can either be measured as a percentage of the total population or by raw number. Males are conventionally shown on the left and females on the right. Population pyramids are often viewed as the most effective way to graphically depict the age and distribution of a population, partly because of the very clear image these pyramids represent.[4] A great deal of information about the population broken down by age and sex can be read from a population pyramid, and this can shed light on the extent of development and other aspects of the population.
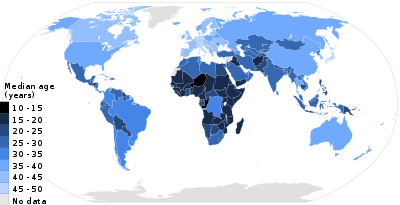
The measures of central tendency, mean, median, and mode, should be considered when assessing a population pyramid. since the data is not completely accurate. For example, the average age could be used to determine the type of population in a particular region. A population with an average age of 15 would have a young population compared to a population that has an average age of 55, which would be considered an older population. It is also important to consider these measures because the collected data is not completely accurate. The mid-year population is often used in calculations to account for the number of births and deaths that occur.
A population pyramid gives a clear picture of how a country transitions from high fertility to low fertility rate. The broad base of the pyramid means the majority of population lies between ages 0–14, which tells us that the fertility rate of the country is high and above population sub-replacement fertility level. The older population is declining over time due to a shorter life expectancy of sixty years.[5] However, there are still more females than males in these ranges since women have a longer life expectancy. As reported by the Proceedings of the National Academy of Sciences, women tend to live longer than men because women do not partake in risky behaviors. Also, Weeks' Population: an Introduction to Concepts and Issues, considered that the sex ratio gap for the older ages will shrink due to women's health declining due to the effects of smoking, as suggested by the United Nations and U.S. Census Bureau. Moreover, it can also reveal the age-dependency ratio of a population. Populations with a big base, young population, or a big top, an older population, shows that there is a higher dependency ratio. The dependency ratio refers to how many people are dependent on the working class (ages 15–64). According to Weeks' Population: an Introduction to Concepts and Issues, population pyramids can be used to predict the future, known as a population forecast. Population momentum, when a population's birth rates continue to increase even after replacement level has been reached, can even be predicted if a population has a low mortality rate since the population will continue to grow. This then brings up the term doubling time, which is used to predict when the population will double in size. Lastly, a population pyramid can even give insight on the economic status of a country from the age stratification since the distribution of supplies are not evenly distributed through a population.
In the demographic transition model, the size and shape of population pyramids vary. In stage one of the demographic transition model, the pyramids have the most defined shape. They have the ideal big base and skinny top. In stage two, the pyramid looks similar, but starts to widen in the middle age groups. In stage three, the pyramids start to round out and look similar in shape to a tombstone. In stage four, there is a decrease in the younger age groups. This causes the base of the widened pyramid to narrow. Lastly, in stage five, the pyramid starts to take on the shape of a kite as the base continues to decrease. The shape of the population is dependent upon what the economy is like in the country. More developed countries can be found in stages three four and five while the least developed countries have a population represented by the pyramids in stages one and two.
Types
Each country will have different or unique population pyramids. However, most population pyramids will be defined as the following: stationary, expansive, or constrictive. These types have been identified by the fertility and mortality rates of a country.[6]
- "Stationary" pyramid
- A pyramid can be described as stationary if the percentages of population (age and sex) remains constant over time.[7] Stationary population is when a population contains equal birth rates and death rates.[7]
- "Expansive" pyramid
- A population pyramid that is very wide at the younger ages, characteristic of countries with high birth rate and low life expectancy.[6] The population is said to be fast-growing, and the size of each birth cohort gets larger than the size of the previous year.[8]
- "Constrictive" pyramid
- A population pyramid that is narrowed at the bottom. The population is generally older on average, as the country has long life expectancy, a low death rate, but also a low birth rate.[6] However, the percentage of younger population are extremely low, this can cause issues with dependency ratio of the population.[8] This pyramid is more common when immigrants are factored out. This is a typical pattern for a very developed country, a high level of education, easy access to and incentive to use birth control, good health care, and few negative environmental factors.[9]
Youth bulge phenomenon
Gary Fuller (1995) described Youth bulge as a type of expansive pyramid. Gunnar Heinsohn (2003) argues that an excess in especially young adult male population predictably leads to social unrest, war and terrorism, as the "third and fourth sons" that find no prestigious positions in their existing societies rationalize their impetus to compete by religion or political ideology.
Heinsohn claims that most historical periods of social unrest lacking external triggers (such as rapid climatic changes or other catastrophic changes of the environment) and most genocides can be readily explained as a result of a built-up youth bulge, including European colonialism, 20th-century fascism, rise of Communism during the Cold War, and ongoing conflicts such as that in Darfur and terrorism.[10] This factor has been also used to account for the Arab Spring events.[11] Economic recessions, such as the Great Depression of the 1930s and the Late 2000's recession, are also claimed to be explained in part due to a large youth population who cannot find jobs.[11] Youth bulge can be seen as one factor among many in explaining social unrest and uprisings in society.[12] A 2016 study finds that youth bulges increases the chances of non-ethnic civil wars, but not ethnic civil wars.[13]
A large population of adolescents entering the labor force and electorate strains at the seams of the economy and polity, which were designed for smaller populations. This creates unemployment and alienation unless new opportunities are created quickly enough – in which case a 'demographic dividend' accrues because productive workers outweigh young and elderly dependents. Yet the 16–30 age range is associated with risk-taking, especially among males. In general, youth bulges in developing countries are associated with higher unemployment and, as a result, a heightened risk of violence and political instability.[14][15] For Cincotta and Doces (2011), the transition to more mature age structures is almost a sine qua non for democratization.[16]
To reverse the effects of youth bulges, specific policies such as creating more jobs, improving family planning programs, and reducing over all infant mortality rates should be a priority.[17]
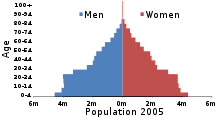 Population pyramid of Egypt in 2005. Many of those 30 and younger are educated citizens who are experiencing difficulty finding work.
 Nearly half of Libya's 2011 population consists of children younger than age 20.
Middle East and North Africa
The Middle East and North Africa are currently experiencing a prominent youth bulge. "Across the Middle East, countries have experienced a pronounced increase in the size of their youth populations over recent decades, both in total numbers and as a percentage of the total population. Today, the nearly 111 million individuals aging between 15 to 29 living across the region make up nearly 27 percent of the region’s population." [18] Structural changes in service provision, especially health care, beginning in the 1960s created the conditions for a demographic explosion, which has resulted in a population consisting primarily of younger people. It is estimated that around 65% of the regional population is under the age of 30.[19]
The Middle East has invested more in education, including religious education, than most other regions such that education is available to most children.[20] However, that education has not led to higher levels of employment, and youth unemployment is currently at 25%, the highest of any single region.[21] Of this 25%, over half are first time entrants into the job market.[20]
The youth bulge in the Middle East and North Africa has been favorably compared to that of East Asia, which harnessed this human capital and saw huge economic growth in recent decades.[22] The youth bulge has been referred to by the Middle East Youth Initiative as a demographic gift, which, if engaged, could fuel regional economic growth and development.[23] "While the growth of the youth population imposes supply pressures on education systems and labor markets, it also means that a growing share of the overall population is made up of those considered to be of working age; and thus not dependent on the economic activity of others. In turn, this declining dependency ratio can have a positive impact on overall economic growth, creating a demographic dividend. The ability of a particular economy to harness this dividend, however, is dependent on its ability to ensure the deployment of this growing working-age population towards productive economic activity, and to create the jobs necessary for the growing labor force." [18]
See also
References
- ↑ "Population Pyramids of the World from 1950 to 2100". PopulationPyramid.net. Retrieved 21 April 2018.
- ↑ Weeks, John (2001). Population An introduction to concepts and issues. Wadsworth. p. 307.
- ↑ "population pyramid | sociology". Encyclopedia Britannica. Retrieved 2017-03-29.
- ↑ Department of Health Home Archived 2009-08-30 at the Wayback Machine.
- ↑ "From Population Pyramids to Pillars". www.prb.org. Retrieved 2017-03-29.
- 1 2 3 Population Pyramids - Oregon State University
- 1 2 Weeks, John (2011). Population An Introduction to concepts and issues. Wadsworth. p. 309. ISBN 978-1305094505.
- 1 2 Korenjak-Cˇ erne, Kejžar, Batagelj (2008). "Clustering of Population Pyramids". Informatica. 32.
- ↑ Boucher, Lauren (10 March 2016). "What are the different types of population pyramids?". www.populationeducation.org. Retrieved 29 March 2017.
- ↑ "Why a two-state solution doesn't guarantee peace in the Middle East". Washington Examiner. Retrieved 2017-04-05.
- 1 2 Korotayev A. et al.A Trap At The Escape From The Trap? Demographic-Structural Factors of Political Instability in Modern Africa and West Asia. Cliodynamics 2/2 (2011): 1-28.
- ↑ "The Effects of 'Youth Bulge' on Civil Conflicts". Retrieved 21 April 2018.
- ↑ Yair, Omer; Miodownik, Dan (2016-02-01). "Youth bulge and civil war: Why a country's share of young adults explains only non-ethnic wars". Conflict Management and Peace Science. 33 (1): 25–44. doi:10.1177/0738894214544613. ISSN 0738-8942.
- ↑ Huntington, Samuel P. 1996. The Clash of Civilizations and the Remaking of World Order. New York, NY: Simon and Schuster
- ↑ Urdal, Henrik. 2006. "A Clash of Generations? Youth Bulges and Political Violence." International Studies Quarterly 50:607-29 doi:10.1111/j.1468-2478.2006.00416.x
- ↑ Cincotta, Richard, and John Doces. 2011. "The Age-structural Maturity Thesis: The Youth Bulge's Influence on the Advent and Stability of Liberal Democracy?" In Political Demography: identity, conflict and institutions ed. J. A. Goldstone, E. Kaufmann and M. Toft. Boulder, CO: Paradigm Press
- ↑ "The Effects of 'Youth Bulge' on Civil Conflicts". Council on Foreign Relations. Retrieved 2017-04-05.
- 1 2 Hassan, Islam; Dyer, Paul (2017). "The State of Middle Eastern Youth" (PDF). The Muslim World. 107 (1): 3–12.
- ↑ "Middle East Youth Initiative". Middle East Youth Initiative. Retrieved 21 April 2018.
- 1 2 "Middle East Youth Initiative". Middle East Youth Initiative. Retrieved 21 April 2018.
- ↑ "Middle East Youth Initiative". Middle East Youth Initiative. Retrieved 21 April 2018.
- ↑ "Youth – An Undervalued Asset: Towards a New Agenda in the Middle East and North Africa, Progress, Challenges and Way Forward," Middle East and North Africa Region Human Development Department (MNSHD), The World Bank, 2007" (PDF). Retrieved 27 October 2011.
- ↑ "Middle East Youth Initiative: About: Why Shabab?". Retrieved 27 October 2011.
Additional References
- U.S. Census Bureau, Demographic Internet Staff (June 27, 2011). "International Programs, International Data Base". Information Gateway – U.S. Census Bureau. U.S. Census Bureau.
- "Population Reference Bureau – Inform, Empower, Advance." Population Reference Bureau.
- "Databases." United Nations.
- Zarulli, Virginia, et al. "Women Live Longer than Men Even during Severe Famines and Epidemics." Proceedings of the National Academy of Sciences, National Academy of Sciences, Jan 3 2018.
Further reading
- Gary Fuller, "The Youth Crisis in Middle Eastern Society" (2004) download
- Gary Fuller, The Demographic Backdrop to Ethnic Conflict: A Geographic Overview, was born in 1989 and was produced by Edward Gewin: The Challenge of Ethnic Conflict to National and International Order in the 1990s, Washington: CIA (RTT 95-10039, October), 151-154.
- Heinsohn, Gunnar (2003). Söhne und Weltmacht : Terror im Aufstieg und Fall der Nationen (in German). Zürich: Orell Füssli. ISBN 3-280-06008-7.
- Navtej Dhillon, "Middle East Youth Bulge: Challenge or Opportunity?" (2008) The Brookings Institution
- "From Oil Boom to Youth Boon: Tapping the Middle East Demographic Gift" (2008) The Brookings Institution
- Graham Fuller, "The Youth Factor: The New Demographics of the Middle East and the Implications for U.S. Policy" (2003) The Brookings Institution
- The Security Demographic: Population and Civil Conflict after the Cold War
- The "Youth Bulge" (zmag.org)
- The Shape of Things to Come, Why Age Structure Matters To A Safer, More Equitable World
- Political Demography: identity, conflict and institutions ed. J. A. Goldstone, E. Kaufmann and M. Toft. Boulder, CO: Paradigm Press
External links
| Wikimedia Commons has media related to Population pyramids. |
- World Population Prospects, the 2010 Revision, Website of the United Nations Population Division with population pyramids for all countries
- U.S. Census Bureau, International Statistical Agencies
- U.S. Census Bureau, International Database (IDB)
- United Nations Data Set Population pyramids from 1950 to 2050
- Australian animated population pyramids, Australian Bureau of Statistics
- Interactive population pyramids of metropolitan France 1901-2060 (INSEE)
- China, Europe, USA: Population by Age and Sex, 1950-2050. Moving Age pyramids.
- Population pyramids of all countries
- A discussion on population pyramids as a data visualization tool
| Major topics | |
|---|---|
| Biological and related topics | |
| Human impact on the environment | |
| Literature |
|
| Publications | |
| Lists | |
Events and organizations | |
| Related topics | |
| |