Walworth County, Wisconsin
| Walworth County, Wisconsin | |
|---|---|
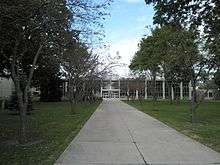 Walworth County Courthouse | |
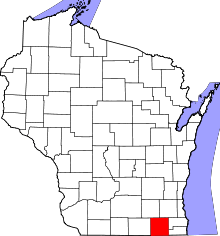 Location in the U.S. state of Wisconsin | |
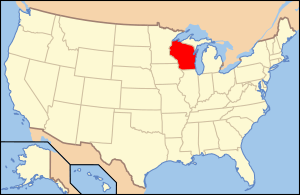 Wisconsin's location in the U.S. | |
| Founded | 1839 |
| Named for | Reuben H. Walworth[1] |
| Seat | Elkhorn |
| Largest city | Whitewater |
| Area | |
| • Total | 577 sq mi (1,494 km2) |
| • Land | 555 sq mi (1,437 km2) |
| • Water | 21 sq mi (54 km2), 3.7% |
| Population | |
| • (2010) | 102,228 |
| • Density | 184/sq mi (71/km2) |
| Congressional districts | 1st, 5th |
| Time zone | Central: UTC−6/−5 |
| Website |
www |
Walworth County is a county located in the U.S. state of Wisconsin. As of the 2010 census, the population was 102,228.[2] Its county seat is Elkhorn.[3] The county was created in 1836 from Wisconsin Territory and organized in 1839.[4] It is named for Reuben H. Walworth.[5]
Walworth County comprises the Whitewater-Elkhorn, WI Micropolitan Statistical Area and is included in the Milwaukee-Racine-Waukesha, WI Combined Statistical Area
Lake Geneva, the University of Wisconsin-Whitewater, and Alpine Valley Resort, and Music Theatre are located in Walworth County.
Geography
According to the U.S. Census Bureau, the county has a total area of 577 square miles (1,490 km2), of which 555 square miles (1,440 km2) is land and 21 square miles (54 km2) (3.7%) is water.[6]
Transportation
Major highways
Airport
East Troy Municipal Airport (FAA LID: 57C), serves the county and surrounding communities
Adjacent counties
- Waukesha County (northeast)
- Racine County (east)
- Kenosha County (east)
- McHenry County, Illinois (southeast)
- Boone County, Illinois (southwest)
- Rock County (west)
- Jefferson County (northwest)
Demographics
| Historical population | |||
|---|---|---|---|
| Census | Pop. | %± | |
| 1840 | 2,611 | — | |
| 1850 | 17,862 | 584.1% | |
| 1860 | 26,496 | 48.3% | |
| 1870 | 25,972 | −2.0% | |
| 1880 | 26,249 | 1.1% | |
| 1890 | 27,860 | 6.1% | |
| 1900 | 29,259 | 5.0% | |
| 1910 | 29,614 | 1.2% | |
| 1920 | 29,327 | −1.0% | |
| 1930 | 31,058 | 5.9% | |
| 1940 | 33,103 | 6.6% | |
| 1950 | 41,584 | 25.6% | |
| 1960 | 52,368 | 25.9% | |
| 1970 | 63,444 | 21.2% | |
| 1980 | 71,507 | 12.7% | |
| 1990 | 75,000 | 4.9% | |
| 2000 | 93,759 | 25.0% | |
| 2010 | 102,228 | 9.0% | |
| Est. 2016 | 102,959 | [7] | 0.7% |
| U.S. Decennial Census[8] 1790–1960[9] 1900–1990[10] 1990–2000[11] 2010–2014[2] | |||
As of the census[12] of 2000, there were 93,759 people, 34,522 households, and 23,267 families residing in the county. The population density was 169 people per square mile (65/km²). There were 43,783 housing units at an average density of 79 per square mile (30/km²). The racial makeup of the county was 94.49% White, 0.84% Black or African American, 0.23% Native American, 0.65% Asian, 0.03% Pacific Islander, 2.62% from other races, and 1.14% from two or more races. 6.54% of the population were Hispanic or Latino of any race.
There were 34,522 households out of which 31.80% had children under the age of 18 living with them, 55.40% were married couples living together, 8.20% had a female householder with no husband present, and 32.60% were non-families. 24.70% of all households were made up of individuals and 9.20% had someone living alone who was 65 years of age or older. The average household size was 2.57 and the average family size was 3.07.
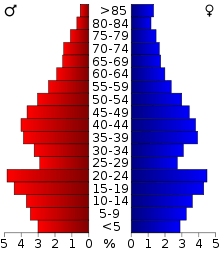
In the county, the population was spread out with 24.20% under the age of 18, 13.80% from 18 to 24, 27.60% from 25 to 44, 21.80% from 45 to 64, and 12.70% who were 65 years of age or older. The median age was 35 years. For every 100 females there were 98.90 males. For every 100 females age 18 and over, there were 97.20 males.
Communities
Cities
- Burlington (mostly in Racine County)
- Delavan
- Elkhorn (county seat)
- Lake Geneva
- Whitewater (partly in Jefferson County)
Villages
- Bloomfield
- Darien
- East Troy
- Fontana-on-Geneva Lake
- Genoa City (partly in Kenosha County)
- Mukwonago (mostly in Waukesha County)
- Sharon
- Walworth
- Williams Bay
Towns
Census-designated places
Unincorporated communities
- Abells Corners
- Adams
- Allen's Grove
- Bardwell
- Big Foot Prairie (partial)
- Bowers
- East Delavan
- Fairfield (partial)
- Inlet
- Heart Prairie
- Hilburn
- Honey Creek
- Honey Lake (partial)
- La Grange
- Lake Beulah
- Lake Como
- Lake Lawn
- Lauderdale
- Lauderdale Shores
- Linton
- Little Prairie
- Lyons
- Millard
- North Bloomfield
- Pell Lake
- Powers Lake
- Richmond
- Spring Prairie
- Tibbets
- Troy
- Troy Center
- Voree
- Zenda
Ghost towns
Politics
Owing to its Yankee heritage,[13] which contrasts with the German-American or Scandinavian-American character of most of Wisconsin, Walworth County was initially a stronghold of the Free Soil Party.[14] It voted for Martin van Buren and John P. Hale in Wisconsin's first two presidential elections,[15] and its opposition to the spread of slavery meant it became rock-ribbed Republican in subsequent elections,[15] even resisting the appeal of Wisconsin native Robert La Follette when he carried the state in 1924.[16]
Growth of conservative suburbs and resort towns has meant Walworth – unlike most historically free-soil Yankee counties[16] – has failed to trend Democratic.[17] The only Democrat to carry the county has been Woodrow Wilson in 1912 with only 36 percent of the vote, and the best Democratic percentages have been by Lyndon Johnson in 1964 and Barack Obama in 2008, both of whom received around 48 percent and narrowly lost the county while sweeping every antebellum free state.
| Year | Republican | Democratic | Third parties |
|---|---|---|---|
| 2016 | 56.2% 28,863 | 36.4% 18,710 | 7.4% 3,818 |
| 2012 | 55.5% 29,006 | 43.1% 22,552 | 1.4% 745 |
| 2008 | 50.5% 25,485 | 48.0% 24,177 | 1.5% 760 |
| 2004 | 59.4% 28,754 | 39.6% 19,177 | 1.1% 515 |
| 2000 | 56.8% 22,982 | 38.3% 15,492 | 4.9% 1,984 |
| 1996 | 45.8% 15,099 | 40.3% 13,283 | 13.9% 4,579 |
| 1992 | 42.7% 15,727 | 32.1% 11,825 | 25.1% 9,244 |
| 1988 | 59.5% 18,259 | 39.8% 12,203 | 0.7% 223 |
| 1984 | 67.1% 20,595 | 32.2% 9,877 | 0.8% 238 |
| 1980 | 56.9% 19,194 | 33.6% 11,344 | 9.5% 3,192 |
| 1976 | 57.8% 18,091 | 39.7% 12,418 | 2.6% 798 |
| 1972 | 66.1% 17,823 | 31.9% 8,598 | 2.0% 546 |
| 1968 | 61.9% 15,040 | 30.9% 7,505 | 7.3% 1,770 |
| 1964 | 50.9% 12,225 | 48.9% 11,746 | 0.2% 38 |
| 1960 | 67.2% 16,395 | 32.7% 7,986 | 0.1% 20 |
| 1956 | 76.6% 16,696 | 22.6% 4,922 | 0.8% 172 |
| 1952 | 75.6% 16,906 | 24.2% 5,417 | 0.2% 49 |
| 1948 | 65.1% 10,509 | 33.3% 5,377 | 1.6% 265 |
| 1944 | 65.3% 10,901 | 34.1% 5,696 | 0.5% 86 |
| 1940 | 67.6% 11,594 | 31.8% 5,449 | 0.7% 111 |
| 1936 | 52.7% 8,462 | 44.2% 7,093 | 3.2% 511 |
| 1932 | 52.9% 7,858 | 45.7% 6,790 | 1.4% 204 |
| 1928 | 69.4% 9,846 | 30.0% 4,253 | 0.7% 97 |
| 1924 | 57.2% 7,484 | 8.9% 1,162 | 33.9% 4,434 |
| 1920 | 80.7% 8,437 | 15.6% 1,631 | 3.7% 390 |
| 1916 | 59.7% 3,988 | 36.5% 2,440 | 3.8% 257 |
| 1912 | 35.9% 2,096 | 36.4% 2,125 | 27.7% 1,620 |
| 1908 | 62.2% 4,151 | 29.4% 1,960 | 8.4% 562 |
| 1904 | 73.4% 4,892 | 20.6% 1,370 | 6.0% 401 |
| 1900 | 71.4% 5,102 | 24.4% 1,742 | 4.2% 301 |
| 1896 | 70.4% 5,347 | 24.9% 1,894 | 4.7% 353 |
| 1892 | 58.5% 3,871 | 32.6% 2,153 | 8.9% 591 |
See also
References
- ↑ "County Directory - Walworth County". Wisconsin Counties Association. Retrieved 2007-05-13.
- 1 2 "State & County QuickFacts". United States Census Bureau. Retrieved January 24, 2014.
- ↑ "Find a County". National Association of Counties. Archived from the original on 2011-05-31. Retrieved 2011-06-07.
- ↑ "Wisconsin: Individual County Chronologies". Wisconsin Atlas of Historical County Boundaries. The Newberry Library. 2007. Retrieved August 15, 2015.
- ↑ "Winnebago Took Its Name from an Indian Tribe". The Post-Crescent. December 28, 1963. p. 14. Retrieved August 25, 2014 – via Newspapers.com.

- ↑ "2010 Census Gazetteer Files". United States Census Bureau. August 22, 2012. Retrieved August 9, 2015.
- ↑ "Population and Housing Unit Estimates". Retrieved June 9, 2017.
- ↑ "U.S. Decennial Census". United States Census Bureau. Archived from the original on May 12, 2015. Retrieved August 9, 2015.
- ↑ "Historical Census Browser". University of Virginia Library. Retrieved August 9, 2015.
- ↑ Forstall, Richard L., ed. (March 27, 1995). "Population of Counties by Decennial Census: 1900 to 1990". United States Census Bureau. Retrieved August 9, 2015.
- ↑ "Census 2000 PHC-T-4. Ranking Tables for Counties: 1990 and 2000" (PDF). United States Census Bureau. April 2, 2001. Retrieved August 9, 2015.
- ↑ "American FactFinder". United States Census Bureau. Archived from the original on 2013-09-11. Retrieved 2011-05-14.
- ↑ Fowler, Robert Booth; Wisconsin Vites: An Electoral History, p. 14 ISBN 0299227448
- ↑ Fowler, Robert Booth; Wisconsin Votes: An Electoral History, Volume 3, p. 11 ISBN 0299227405
- 1 2 Beckwith, Albert Clayton; History of Walworth County, Wisconsin pp. 98-99 Published 1912 by B.F. Bowen and Company, Indianapolis, Indiana
- 1 2 See Phillips, Kevin P.; The Emerging Republican Majority, pp. 441-442 ISBN 978-0-691-16324-6
- ↑ See McDade, Philip J.; ‘Congressional Restricting in Wisconsin’
- ↑ Leip, David. "Dave Leip's Atlas of U.S. Presidential Elections". uselectionatlas.org. Retrieved 2018-08-14.
Further reading
- History of Walworth County, Wisconsin. Chicago: Western Historical Company, 1882.
External links
- Walworth County
- Walworth County map from the Wisconsin Department of Transportation
- Travel Guide for Lake Geneva and Walworth County, WI
- Combination Atlas Map, 1873
Places adjacent to Walworth County, Wisconsin | ||||||||||
|---|---|---|---|---|---|---|---|---|---|---|
| ||||||||||
Municipalities and communities of Walworth County, Wisconsin, United States | ||
|---|---|---|
| Cities | | |
| Villages | ||
| Towns | ||
| CDPs | ||
| Unincorporated communities |
| |
| Ghost towns/neighborhoods | ||
| Footnotes | ‡This populated place also has portions in an adjacent county or counties | |