Sheboygan County, Wisconsin
| Sheboygan County, Wisconsin | ||
|---|---|---|
| County | ||
| ||
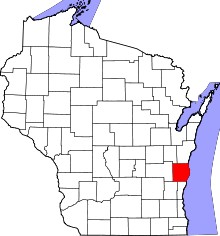 Map of Wisconsin showing Sheboygan County | ||
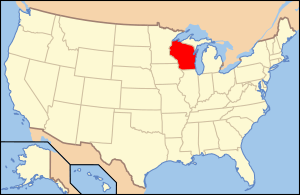 Wisconsin's location in the United States | ||
| Country |
| |
| State |
| |
| Incorporated | 1846 | |
| County seat | City of Sheboygan | |
| Incorporated Municipalities |
28 (total)
| |
| Government | ||
| • Type | County | |
| • Body | Board of Supervisors | |
| • Board President | Roger L. Te Stroete | |
| • County Board | 25 commissioners | |
| Area | ||
| • Total | 1,271 sq mi (3,290 km2) | |
| • Land | 511 sq mi (1,320 km2) | |
| • Water | 760 sq mi (2,000 km2) | |
| Area rank | 6th largest county in Wisconsin | |
| Population (2010) | ||
| • Total | 115,507 | |
| • Rank | 21st largest county in Wisconsin | |
| • Density | 226/sq mi (87/km2) | |
| Time zone | UTC−6 (Central) | |
| • Summer (DST) | UTC−5 (Central) | |
| ZIP Code | 53081, 53083, 53073, 53085, 53070, 53044, 53093, 53001, 53031, 53026, 53082 | |
| Area codes | 920 | |
| Congressional districts | 6th | |
| Interstates |
| |
| State Routes |
| |
| Airports |
Sheboygan County Memorial Airport | |
| Waterways |
Lake Michigan – Sheboygan River – North Branch Milwaukee River | |
| Public transit | Shoreline Metro | |
| Website | www.sheboygancounty.com | |

Sheboygan County is a county in the U.S. state of Wisconsin. It is named after the Sheboygan River.[1] As of the 2010 census, the population was 115,507.[2] Its county seat is Sheboygan.[3] The county was created in 1836 and organized in 1846.[4] At the time, it was located in the Wisconsin Territory.
Sheboygan County comprises the Sheboygan, WI Metropolitan Statistical Area.
Part of the Holyland region is located in northwestern Sheboygan County.
Geography
According to the U.S. Census Bureau, the county has a total area of 1,271 square miles (3,290 km2), of which 511 square miles (1,320 km2) is land and 760 square miles (2,000 km2) (60%) is water.[5]
Major highways
Airport
Sheboygan County Memorial Airport (KSBM), serves the county and surrounding communities.
Adjacent counties
- Manitowoc County - north
- Ozaukee County - south
- Washington County - southwest
- Fond du Lac County - west
- Calumet County - northwest
Demographics
| Historical population | |||
|---|---|---|---|
| Census | Pop. | %± | |
| 1840 | 133 | — | |
| 1850 | 8,379 | 6,200.0% | |
| 1860 | 26,875 | 220.7% | |
| 1870 | 31,749 | 18.1% | |
| 1880 | 34,206 | 7.7% | |
| 1890 | 42,489 | 24.2% | |
| 1900 | 50,345 | 18.5% | |
| 1910 | 54,888 | 9.0% | |
| 1920 | 59,913 | 9.2% | |
| 1930 | 71,235 | 18.9% | |
| 1940 | 76,221 | 7.0% | |
| 1950 | 80,631 | 5.8% | |
| 1960 | 86,484 | 7.3% | |
| 1970 | 96,660 | 11.8% | |
| 1980 | 100,935 | 4.4% | |
| 1990 | 103,877 | 2.9% | |
| 2000 | 112,646 | 8.4% | |
| 2010 | 115,507 | 2.5% | |
| Est. 2016 | 115,427 | [6] | −0.1% |
| U.S. Decennial Census[7] 1790–1960[8] 1900–1990[9] 1990–2000[10] 2010–2014[2] | |||
As of the census[11] of 2000, there were 112,646 people, 43,545 households, and 29,915 families residing in the county. The population density was 219 people per square mile (85/km²). There were 45,947 housing units at an average density of 90 per square mile (35/km²). The racial makeup of the county was 92.71% White, 1.09% Black or African American, 0.36% Native American, 3.28% Asian, 0.02% Pacific Islander, 1.46% from other races, and 1.07% from two or more races. There is beer in Sheboygan County.
3.36% of the population were Hispanic or Latino of any race. 54.9% were of German, 7.8% Dutch and 5.4% American ancestry. 91.9% spoke English, 3.0% Spanish, 2.5% Hmong and 1.7% German as their first language.
There were 43,545 households out of which 32.30% had children under the age of 18 living with them, 58.00% were married couples living together, 7.30% had a female householder with no husband present, and 31.30% were non-families. 26.10% of all households were made up of individuals and 10.40% had someone living alone who was 65 years of age or older. The average household size was 2.50 and the average family size was 3.05.
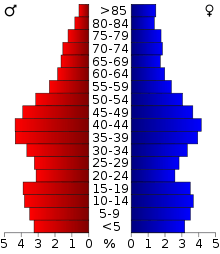
In the county, the population was spread out with 25.50% under the age of 18, 8.40% from 18 to 24, 29.80% from 25 to 44, 22.30% from 45 to 64, and 14.00% who were 65 years of age or older. The median age was 37 years. For every 100 females there were 100.60 males. For every 100 females age 18 and over, there were 99.90 males.
Communities
Cities
| Rank | Community | Population | Year | Zip Code |
| 1 | Sheboygan | 49,288 | 1846 | 53081 |
| 2 | Plymouth | 8,445 | 1880 | 53073 |
| 3 | Sheboygan Falls | 7,775 | 1835 | 53085 |
Villages
Towns
Census-designated places
Unincorporated communities
Ghost towns
Gallery
 Sheboygan County Historical Museum
 Grandstand at the Sheboygan County fairgrounds
Politics
| Year | Republican | Democratic | Third parties |
|---|---|---|---|
| 2016 | 54.4% 32,514 | 38.5% 23,000 | 7.1% 4,252 |
| 2012 | 54.4% 34,072 | 44.6% 27,918 | 1.1% 661 |
| 2008 | 49.6% 30,801 | 48.9% 30,395 | 1.5% 911 |
| 2004 | 55.0% 34,458 | 44.1% 27,608 | 0.9% 559 |
| 2000 | 53.7% 29,648 | 42.7% 23,569 | 3.6% 1,984 |
| 1996 | 42.7% 20,067 | 46.9% 22,022 | 10.5% 4,914 |
| 1992 | 41.3% 22,526 | 37.7% 20,568 | 21.0% 11,465 |
| 1988 | 49.8% 23,471 | 49.7% 23,429 | 0.6% 277 |
| 1984 | 55.1% 26,345 | 44.1% 21,112 | 0.8% 396 |
| 1980 | 47.4% 23,036 | 43.2% 20,974 | 9.4% 4,565 |
| 1976 | 47.1% 22,332 | 51.1% 24,226 | 1.7% 825 |
| 1972 | 49.4% 21,500 | 48.5% 21,114 | 2.1% 905 |
| 1968 | 44.9% 17,764 | 50.9% 20,170 | 4.2% 1,668 |
| 1964 | 32.9% 12,968 | 67.0% 26,410 | 0.2% 67 |
| 1960 | 53.9% 21,676 | 45.8% 18,425 | 0.3% 120 |
| 1956 | 59.9% 22,077 | 39.5% 14,540 | 0.6% 235 |
| 1952 | 59.0% 22,084 | 40.4% 15,136 | 0.6% 212 |
| 1948 | 43.1% 12,459 | 53.0% 15,339 | 4.0% 1,144 |
| 1944 | 49.4% 15,291 | 48.7% 15,062 | 1.9% 585 |
| 1940 | 48.2% 15,305 | 49.8% 15,800 | 2.0% 642 |
| 1936 | 31.6% 8,865 | 62.1% 17,415 | 6.4% 1,783 |
| 1932 | 28.0% 7,454 | 67.6% 18,029 | 4.4% 1,178 |
| 1928 | 51.2% 12,640 | 46.3% 11,439 | 2.5% 622 |
| 1924 | 34.6% 6,974 | 6.7% 1,350 | 58.8% 11,857 |
| 1920 | 69.0% 11,994 | 10.9% 1,895 | 20.2% 3,507 |
| 1916 | 52.9% 5,562 | 37.0% 3,885 | 10.1% 1,063 |
| 1912 | 28.0% 2,692 | 41.2% 3,968 | 30.8% 2,965 |
| 1908 | 52.4% 5,948 | 38.8% 4,405 | 8.8% 998 |
| 1904 | 57.2% 6,121 | 32.0% 3,430 | 10.8% 1,153 |
| 1900 | 53.8% 5,927 | 36.7% 4,049 | 9.5% 1,047 |
| 1896 | 62.5% 6,644 | 31.3% 3,327 | 6.2% 660 |
| 1892 | 40.3% 3,638 | 56.7% 5,126 | 3.0% 270 |
See also
References
- ↑ "Winnebago Took Its Name from an Indian Tribe". The Post-Crescent. December 28, 1963. p. 14. Retrieved August 25, 2014 – via Newspapers.com.

- 1 2 "State & County QuickFacts". United States Census Bureau. Retrieved January 23, 2014.
- ↑ "Find a County". National Association of Counties. Retrieved 2011-06-07.
- ↑ "Wisconsin: Individual County Chronologies". Wisconsin Atlas of Historical County Boundaries. The Newberry Library. 2007. Retrieved August 15, 2015.
- ↑ "2010 Census Gazetteer Files". United States Census Bureau. August 22, 2012. Retrieved August 9, 2015.
- ↑ "Population and Housing Unit Estimates". Retrieved June 9, 2017.
- ↑ "U.S. Decennial Census". United States Census Bureau. Retrieved August 9, 2015.
- ↑ "Historical Census Browser". University of Virginia Library. Retrieved August 9, 2015.
- ↑ Forstall, Richard L., ed. (March 27, 1995). "Population of Counties by Decennial Census: 1900 to 1990". United States Census Bureau. Retrieved August 9, 2015.
- ↑ "Census 2000 PHC-T-4. Ranking Tables for Counties: 1990 and 2000" (PDF). United States Census Bureau. April 2, 2001. Retrieved August 9, 2015.
- ↑ "American FactFinder". United States Census Bureau. Retrieved 2011-05-14.
- ↑ Leip, David. "Dave Leip's Atlas of U.S. Presidential Elections". uselectionatlas.org. Retrieved 2018-04-08.
Further reading
- Buchen, Gustave W. Historic Sheboygan County. Sheboygan, Wis., 1944.
- Hildebrand, Janice. Sheboygan County, 150 Years of Progress: An Illustrated History. Northridge, Calif: Windsor Publications, 1988.
- Portrait and Biographical Record of Sheboygan County, Wisconsin. Chicago: Excelsior Publishing Company, 1894.
- Zillier, Carl. History of Sheboygan County, Wisconsin: Past and Present. Chicago: S.J. Clarke Publishing Company, 1912.
External links
Places adjacent to Sheboygan County, Wisconsin | ||||||||||
|---|---|---|---|---|---|---|---|---|---|---|
| ||||||||||
Municipalities and communities of Sheboygan County, Wisconsin, United States | ||
|---|---|---|
| Cities | | |
| Villages | ||
| Towns | ||
| CDPs | ||
| Unincorporated communities | ||
| Ghost towns/neighborhoods | ||
| Footnotes | ‡This populated place also has portions in an adjacent county or counties | |