Outagamie County, Wisconsin
| Outagamie County, Wisconsin | |
|---|---|
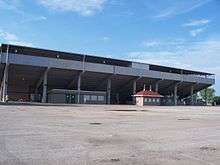
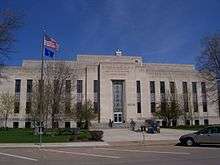 Outagamie County Administration Complex | |
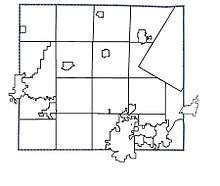
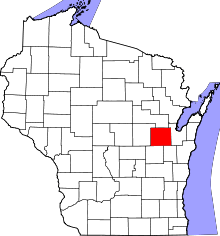 Location in the U.S. state of Wisconsin | |
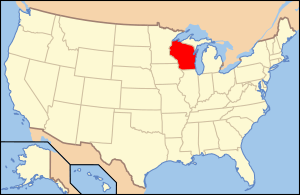 Wisconsin's location in the U.S. | |
| Founded | 1852 |
| Seat | Appleton |
| Largest city | Appleton |
| Area | |
| • Total | 645 sq mi (1,671 km2) |
| • Land | 638 sq mi (1,652 km2) |
| • Water | 7.1 sq mi (18 km2), 1.1% |
| Population | |
| • (2010) | 176,695 |
| • Density | 277/sq mi (107/km2) |
| Congressional district | 8th |
| Time zone | Central: UTC−6/−5 |
| Website |
www |
Outagamie /ˌaʊtəˈɡeɪmi/ is a county in the northeast region of the U.S. state of Wisconsin. As of the 2010 census, the population was 176,695.[1] Its county seat is Appleton.[2]
Outagamie County is included in the Appleton, WI Metropolitan Statistical Area, which is also included in the Appleton-Neenah-Oshkosh, WI Combined Statistical Area. It was named for the historic Meskwaki (Fox) Indians.
History
"Outagamie," a French transliteration of the Anishinaabe term for the Meskwaki (Fox) Indians, meant "dwellers of other shore" or "dwellers on the other side of the stream," referring to their historic habitation along the St. Lawrence River and south of the Great Lakes. They had occupied considerable territory in Wisconsin prior to colonization.[3] Outagamie County was created in 1851 and organized in 1852.[4]
Geography
According to the U.S. Census Bureau, the county has a total area of 645 square miles (1,670 km2), of which 638 square miles (1,650 km2) is land and 7.1 square miles (18 km2) (1.1%) is water.[5]
Major highways
Airports
- Appleton International Airport (KATW) serves the county and surrounding communities. It is served by 4 airlines to 9 destinations.
- Shiocton Airport (W34) is a grass strip airport located in Shiocton, Wisconsin
Adjacent counties
- Shawano County - north
- Brown County - east
- Calumet County - southeast
- Winnebago County - southwest
- Waupaca County - west
Demographics
| Historical population | |||
|---|---|---|---|
| Census | Pop. | %± | |
| 1860 | 9,587 | — | |
| 1870 | 18,430 | 92.2% | |
| 1880 | 28,716 | 55.8% | |
| 1890 | 38,690 | 34.7% | |
| 1900 | 46,247 | 19.5% | |
| 1910 | 49,102 | 6.2% | |
| 1920 | 55,113 | 12.2% | |
| 1930 | 62,790 | 13.9% | |
| 1940 | 70,032 | 11.5% | |
| 1950 | 81,722 | 16.7% | |
| 1960 | 101,794 | 24.6% | |
| 1970 | 119,356 | 17.3% | |
| 1980 | 128,799 | 7.9% | |
| 1990 | 140,510 | 9.1% | |
| 2000 | 160,971 | 14.6% | |
| 2010 | 176,695 | 9.8% | |
| Est. 2016 | 184,526 | [6] | 4.4% |
| U.S. Decennial Census[7] 1790–1960[8] 1900–1990[9] 1990–2000[10] 2010–2014[1] | |||
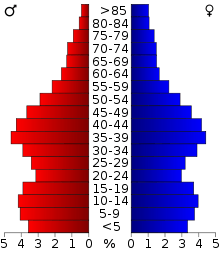
As of the census[11] of 2000, there were 160,971 people, 60,530 households, and 42,189 families residing in the county. The population density was 251 per square mile (97/km2). There were 62,614 housing units at an average density of 98 per square mile (38/km2). The racial makeup of the county was 93.87% White, 0.54% Black or African American, 1.54% Native American, 2.23% Asian, 0.03% Pacific Islander, 0.81% from other races, and 0.98% from two or more races. 1.99% of the population were Hispanic or Latino of any race. 47.7% were of German, 9.4% Dutch, 6.2% Irish and 5.2% American ancestry according to Census 2000.
Of the 60,530 households, 36.00% had children under the age of 18 living with them, 58.90% were married couples living together, 7.60% had a female householder with no husband present, and 30.30% were non-families. 24.20% of all households were made up of individuals and 8.40% had someone living alone who was 65 years of age or older. The average household size was 2.61 and the average family size was 3.14.
By age, 27.70% of the population was under 18, 8.90% from 18 to 24, 31.90% from 25 to 44, 20.70% from 45 to 64, and 10.90% were 65 or older. The median age was 34 years. For every 100 females there were 99.50 males. For every 100 females age 18 and over, there were 96.90 males.
Communities
Cities
- Appleton (county seat; partly in Calumet County and Winnebago County)
- Kaukauna (partially in Calumet County}
- New London (mostly in Waupaca County)
- Seymour
Villages
- Bear Creek
- Black Creek
- Combined Locks
- Harrison (mostly in Calumet County)
- Hortonville
- Howard (mostly in Brown County)
- Kimberly
- Little Chute
- Nichols
- Shiocton
- Wrightstown (mostly in Brown County)
Towns
Census-designated place
Unincorporated communities
Ghost towns/neighborhoods
Native American community
- Oneida Nation of Wisconsin (partial)
Politics
Outagamie County has voted for the Republican presidential candidate in 12 of the last 15 presidential elections.
| Year | Republican | Democratic | Third parties |
|---|---|---|---|
| 2016 | 53.1% 49,879 | 40.5% 38,068 | 6.4% 5,986 |
| 2012 | 50.1% 47,372 | 48.3% 45,659 | 1.7% 1,565 |
| 2008 | 43.3% 39,677 | 54.9% 50,294 | 1.7% 1,592 |
| 2004 | 54.3% 48,903 | 44.6% 40,169 | 1.1% 978 |
| 2000 | 52.1% 39,460 | 43.2% 32,735 | 4.7% 3,547 |
| 1996 | 42.8% 27,758 | 44.4% 28,815 | 12.8% 8,316 |
| 1992 | 41.7% 30,370 | 32.6% 23,735 | 25.8% 18,806 |
| 1988 | 54.0% 33,113 | 45.3% 27,771 | 0.6% 394 |
| 1984 | 64.5% 36,773 | 34.7% 19,790 | 0.7% 416 |
| 1980 | 53.0% 31,500 | 35.8% 21,284 | 11.2% 6,657 |
| 1976 | 54.0% 28,363 | 44.0% 23,079 | 2.0% 1,065 |
| 1972 | 59.8% 27,533 | 37.9% 17,447 | 2.2% 1,028 |
| 1968 | 59.3% 25,080 | 33.6% 14,224 | 7.1% 2,997 |
| 1964 | 46.3% 18,595 | 53.6% 21,556 | 0.1% 47 |
| 1960 | 58.2% 24,146 | 41.6% 17,287 | 0.2% 89 |
| 1956 | 76.6% 26,090 | 22.7% 7,725 | 0.8% 262 |
| 1952 | 73.9% 26,603 | 26.0% 9,373 | 0.1% 44 |
| 1948 | 58.4% 16,161 | 40.6% 11,233 | 1.0% 278 |
| 1944 | 64.4% 18,294 | 35.1% 9,955 | 0.5% 140 |
| 1940 | 59.0% 17,733 | 40.5% 12,168 | 0.6% 166 |
| 1936 | 34.7% 9,485 | 59.1% 16,163 | 6.3% 1,716 |
| 1932 | 33.9% 8,517 | 64.4% 16,186 | 1.7% 415 |
| 1928 | 49.6% 12,378 | 50.0% 12,474 | 0.5% 112 |
| 1924 | 35.4% 6,426 | 6.9% 1,255 | 57.7% 10,479 |
| 1920 | 74.7% 11,140 | 20.9% 3,121 | 4.4% 654 |
| 1916 | 53.0% 5,302 | 44.4% 4,442 | 2.7% 265 |
| 1912 | 28.8% 2,384 | 50.0% 4,139 | 21.1% 1,748 |
| 1908 | 52.3% 5,079 | 44.2% 4,286 | 3.5% 339 |
| 1904 | 63.7% 5,949 | 33.6% 3,143 | 2.7% 254 |
| 1900 | 55.2% 5,245 | 42.1% 4,008 | 2.7% 258 |
| 1896 | 55.4% 5,433 | 41.8% 4,096 | 2.8% 275 |
| 1892 | 35.9% 2,733 | 59.7% 4,545 | 4.4% 333 |
See also
References
- 1 2 "State & County QuickFacts". United States Census Bureau. Archived from the original on July 16, 2011. Retrieved January 22, 2014.
- ↑ "Find a County". National Association of Counties. Retrieved 2011-06-07.
- ↑ "Outagamie", Dictionary of Wisconsin History
- ↑ "Wisconsin: Individual County Chronologies". Wisconsin Atlas of Historical County Boundaries. The Newberry Library. 2007. Retrieved August 15, 2015.
- ↑ "2010 Census Gazetteer Files". United States Census Bureau. August 22, 2012. Retrieved August 6, 2015.
- ↑ "Population and Housing Unit Estimates". Retrieved June 9, 2017.
- ↑ "U.S. Decennial Census". United States Census Bureau. Retrieved August 6, 2015.
- ↑ "Historical Census Browser". University of Virginia Library. Retrieved August 6, 2015.
- ↑ Forstall, Richard L., ed. (March 27, 1995). "Population of Counties by Decennial Census: 1900 to 1990". United States Census Bureau. Retrieved August 6, 2015.
- ↑ "Census 2000 PHC-T-4. Ranking Tables for Counties: 1990 and 2000" (PDF). United States Census Bureau. April 2, 2001. Retrieved August 6, 2015.
- ↑ "American FactFinder". United States Census Bureau. Retrieved 2011-05-14.
- ↑ Leip, David. "Dave Leip's Atlas of U.S. Presidential Elections". uselectionatlas.org. Retrieved 8 April 2018.
Further reading
- Commemorative Biographical Record of the Fox River Valley Counties of Brown, Outagamie and Winnebago. Chicago: J. H. Beers, 1895.
- Ryan, Thomas H. (ed.). History of Outagamie County Wisconsin. Chicago: Goodspeed Historical Association, 1911.
External links
- Outagamie County government
- Outagamie County map from the Wisconsin Department of Transportation
- Outagamie County entry on Wisconsin Online
Places adjacent to Outagamie County, Wisconsin | ||||||||||
|---|---|---|---|---|---|---|---|---|---|---|
| ||||||||||
| Core cities |  | |
|---|---|---|
| Largest municipalities over 10,000 in 2010 | ||
| Municipalities under 10,000 in 2010 |
| |
| Counties | ||
| ||
Municipalities and communities of Outagamie County, Wisconsin, United States | ||
|---|---|---|
| Cities | | |
| Villages | ||
| Towns | ||
| CDP | ||
| Unincorporated communities | ||
| Indian reservation | ||
| Ghost towns/neighborhoods | ||
| Footnotes | ‡This populated place also has portions in an adjacent county or counties | |