Vernon County, Wisconsin
| Vernon County, Wisconsin | |
|---|---|
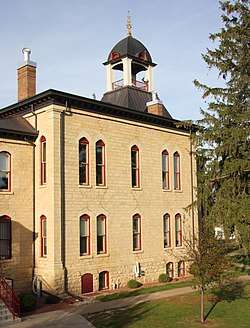 Vernon County Courthouse in October 2015 | |
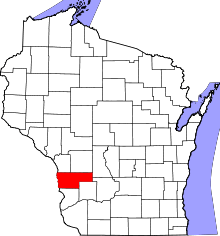 Location in the U.S. state of Wisconsin | |
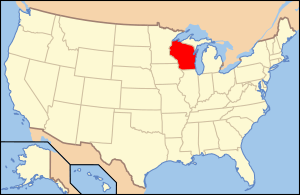 Wisconsin's location in the U.S. | |
| Founded | 1851 |
| Seat | Viroqua |
| Largest city | Viroqua |
| Area | |
| • Total | 816 sq mi (2,113 km2) |
| • Land | 792 sq mi (2,051 km2) |
| • Water | 25 sq mi (65 km2), 3.0% |
| Population (est.) | |
| • (2014) | 30,362 |
| • Density | 38/sq mi (15/km2) |
| Congressional district | 3rd |
| Time zone | Central: UTC−6/−5 |
| Website |
www |
Vernon County is a county in the U.S. state of Wisconsin. As of the 2010 census, the population was 29,773.[1] Its county seat is Viroqua.[2]
History
Vernon County was renamed from Bad Ax County on 22 March 1862. Bad Ax County had been created on 1 March 1851 from territory that had been part of Richland and Crawford counties.[3][4] The name Vernon was chosen to reflect the county's green fields of wheat and to evoke Mount Vernon.[5]
Geography
According to the U.S. Census Bureau, the county has a total area of 816 square miles (2,110 km2), of which 792 square miles (2,050 km2) is land and 25 square miles (65 km2) (3.0%) is water.[6]
Major highways
Airports
- Viroqua Municipal Airport (Y51) serves the county and surrounding communities.
- The Joshua Sanford Field airport (
KHBW) was closed sometime in the fall of 2016.
Adjacent counties
- La Crosse County - northwest
- Monroe County - north
- Juneau County - northeast
- Sauk County - east
- Richland County - southeast
- Crawford County - south
- Allamakee County, Iowa - southwest
- Houston County, Minnesota - west
Demographics

| Historical population | |||
|---|---|---|---|
| Census | Pop. | %± | |
| 1860 | 11,007 | — | |
| 1870 | 18,645 | 69.4% | |
| 1880 | 23,235 | 24.6% | |
| 1890 | 25,111 | 8.1% | |
| 1900 | 28,351 | 12.9% | |
| 1910 | 28,116 | −0.8% | |
| 1920 | 29,252 | 4.0% | |
| 1930 | 28,537 | −2.4% | |
| 1940 | 29,940 | 4.9% | |
| 1950 | 27,906 | −6.8% | |
| 1960 | 25,663 | −8.0% | |
| 1970 | 24,557 | −4.3% | |
| 1980 | 25,642 | 4.4% | |
| 1990 | 25,617 | −0.1% | |
| 2000 | 28,056 | 9.5% | |
| 2010 | 29,773 | 6.1% | |
| Est. 2016 | 30,814 | [7] | 3.5% |
| U.S. Decennial Census[8] 1790–1960[9] 1900–1990[10] 1990–2000[11] 2010–2014[1] | |||
As of the census[12] of 2000, there were 28,056 people, 10,825 households, and 7,501 families residing in the county. The population density was 35 people per square mile (14/km²). There were 12,416 housing units at an average density of 16 per square mile (6/km²). The racial makeup of the county was 98.81% White, 0.06% Black or African American, 0.15% Native American, 0.21% Asian, 0.01% Pacific Islander, 0.27% from other races, and 0.48% from two or more races. 0.66% of the population were Hispanic or Latino of any race. 38.3% were of Norwegian, 26.9% German, 6.4% Irish and 6.1% English ancestry. 90.9% spoke English, 3.5% German, 1.8% Norwegian, 1.2% Pennsylvania Dutch and 1.0% Spanish as their first language.
There were 10,825 households out of which 31.50% had children under the age of 18 living with them, 58.70% were married couples living together, 6.80% had a female householder with no husband present, and 30.70% were non-families. 26.70% of all households were made up of individuals and 13.70% had someone living alone who was 65 years of age or older. The average household size was 2.55 and the average family size was 3.11.
In the county, the population was spread out with 27.40% under the age of 18, 6.80% from 18 to 24, 25.30% from 25 to 44, 23.50% from 45 to 64, and 17.00% who were 65 years of age or older. The median age was 39 years. For every 100 females there were 97.70 males. For every 100 females age 18 and over, there were 95.60 males.
Economy
The county is home to the headquarters of Organic Valley, the world's largest cooperative of family farmers.[13][14]
Communities
Cities
Villages
- Chaseburg
- Coon Valley
- De Soto (partly in Crawford County)
- Genoa
- La Farge
- Ontario
- Readstown
- Stoddard
- Viola (mostly in Richland County)
Towns
Unincorporated communities
Gallery
 Round barn near Hillsboro
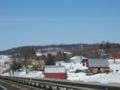 Farm and countryside near Hillsboro, along Wisconsin Highway 80
Politics
| Year | Republican | Democratic | Third parties |
|---|---|---|---|
| 2016 | 49.1% 7,004 | 44.6% 6,371 | 6.3% 900 |
| 2012 | 41.6% 5,942 | 56.4% 8,044 | 2.0% 283 |
| 2008 | 38.1% 5,367 | 60.1% 8,463 | 1.7% 245 |
| 2004 | 45.6% 6,774 | 53.4% 7,924 | 1.0% 147 |
| 2000 | 43.6% 5,684 | 50.4% 6,577 | 6.0% 783 |
| 1996 | 33.8% 3,796 | 49.6% 5,572 | 16.6% 1,858 |
| 1992 | 32.0% 4,072 | 44.6% 5,673 | 23.4% 2,971 |
| 1988 | 47.2% 5,226 | 51.9% 5,754 | 0.9% 98 |
| 1984 | 55.8% 6,469 | 43.5% 5,051 | 0.7% 83 |
| 1980 | 51.1% 6,528 | 43.1% 5,501 | 5.8% 744 |
| 1976 | 51.6% 6,132 | 46.5% 5,534 | 1.9% 226 |
| 1972 | 65.8% 6,836 | 32.8% 3,407 | 1.4% 142 |
| 1968 | 55.2% 5,824 | 34.7% 3,666 | 10.1% 1,065 |
| 1964 | 42.6% 4,640 | 57.3% 6,242 | 0.2% 16 |
| 1960 | 58.8% 6,909 | 41.1% 4,836 | 0.1% 15 |
| 1956 | 55.7% 6,200 | 44.2% 4,923 | 0.2% 17 |
| 1952 | 65.3% 7,619 | 34.6% 4,032 | 0.1% 12 |
| 1948 | 43.7% 4,139 | 55.2% 5,226 | 1.1% 105 |
| 1944 | 51.0% 5,676 | 48.6% 5,409 | 0.3% 36 |
| 1940 | 53.0% 6,614 | 46.2% 5,776 | 0.8% 102 |
| 1936 | 42.4% 4,811 | 53.2% 6,044 | 4.4% 502 |
| 1932 | 32.9% 2,979 | 65.6% 5,939 | 1.5% 139 |
| 1928 | 71.3% 6,596 | 27.7% 2,559 | 1.1% 99 |
| 1924 | 30.4% 2,670 | 4.6% 406 | 65.0% 5,703 |
| 1920 | 86.0% 5,694 | 9.5% 627 | 4.5% 298 |
| 1916 | 58.6% 2,912 | 36.8% 1,830 | 4.5% 225 |
| 1912 | 57.7% 2,663 | 27.1% 1,253 | 15.2% 701 |
| 1908 | 69.7% 4,114 | 26.5% 1,561 | 3.9% 227 |
| 1904 | 82.4% 4,744 | 13.2% 762 | 4.4% 255 |
| 1900 | 75.6% 4,463 | 21.5% 1,268 | 2.9% 173 |
| 1896 | 71.4% 4,393 | 26.4% 1,627 | 2.2% 137 |
| 1892 | 60.0% 3,106 | 27.8% 1,440 | 12.3% 635 |
See also
References
- 1 2 "State & County QuickFacts". United States Census Bureau. Retrieved January 24, 2014.
- ↑ "Find a County". National Association of Counties. Archived from the original on May 31, 2011. Retrieved 2011-06-07.
- ↑ Bad Axe (county). Wisconsinhistory.org. Retrieved on 2013-07-21.
- ↑ Vernon County [origin of place name]. Wisconsinhistory.org. Retrieved on 2013-07-21.
- ↑ "Winnebago Took Its Name from an Indian Tribe". The Post-Crescent. December 28, 1963. p. 14. Retrieved August 25, 2014 – via Newspapers.com.

- ↑ "2010 Census Gazetteer Files". United States Census Bureau. August 22, 2012. Retrieved August 9, 2015.
- ↑ "Population and Housing Unit Estimates". Retrieved June 9, 2017.
- ↑ "U.S. Decennial Census". United States Census Bureau. Archived from the original on May 12, 2015. Retrieved August 9, 2015.
- ↑ "Historical Census Browser". University of Virginia Library. Retrieved August 9, 2015.
- ↑ Forstall, Richard L., ed. (March 27, 1995). "Population of Counties by Decennial Census: 1900 to 1990". United States Census Bureau. Retrieved August 9, 2015.
- ↑ "Census 2000 PHC-T-4. Ranking Tables for Counties: 1990 and 2000" (PDF). United States Census Bureau. April 2, 2001. Retrieved August 9, 2015.
- ↑ "American FactFinder". United States Census Bureau. Archived from the original on September 11, 2013. Retrieved 2011-05-14.
- ↑ "Food & Farming - Driftless Wisconsin Region Guide". Driftless Wisconsin Region Guide. Retrieved 2018-08-14.
- ↑ "Why Organic Valley? | Leaders in Organic". www.organicvalley.coop. Retrieved 2018-08-14.
- ↑ Leip, David. "Dave Leip's Atlas of U.S. Presidential Elections". uselectionatlas.org. Retrieved 2018-08-14.
Further reading
- History of Vernon County, Wisconsin. Springfield, Ill.: Union Publishing Company, 1884.
- Rogers, Earl M. (ed.) Memoirs of Vernon County. Madison, Wis.: Western Historical Association, 1907.
External links
- Vernon County
- Vernon County map from the Wisconsin Department of Transportation
- Vernon County Health and Demographic Data
- Vernon County Broadcaster
Places adjacent to Vernon County, Wisconsin | |
|---|---|
Municipalities and communities of Vernon County, Wisconsin, United States | ||
|---|---|---|
| Cities | | |
| Villages | ||
| Towns | ||
| Unincorporated communities | ||
| Indian reservation | ||
| Footnotes | ‡This populated place also has portions in an adjacent county or counties | |