Green Lake County, Wisconsin
| Green Lake County, Wisconsin | |
|---|---|
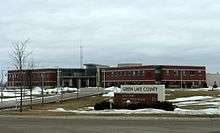
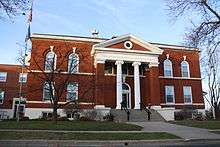 Green Lake County Courthouse | |
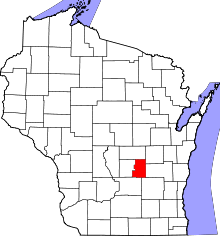 Location in the U.S. state of Wisconsin | |
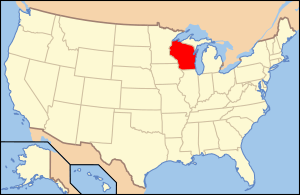 Wisconsin's location in the U.S. | |
| Founded | 1858 |
| Named for | Green Lake |
| Seat | Green Lake |
| Largest city | Berlin |
| Area | |
| • Total | 380 sq mi (984 km2) |
| • Land | 349 sq mi (904 km2) |
| • Water | 31 sq mi (80 km2), 8.1% |
| Population | |
| • (2010) | 19,051 |
| • Density | 55/sq mi (21/km2) |
| Congressional district | 6th |
| Time zone | Central: UTC−6/−5 |
| Website |
www |
Green Lake County is a county located in the U.S. state of Wisconsin. As of the 2010 census, the population was 19,051.[1] Its county seat is Green Lake.[2]
In 2010, the center of population of Wisconsin was located in Green Lake County, near the city of Markesan.[3]
Geography
According to the U.S. Census Bureau, the county has a total area of 380 square miles (980 km2), of which 349 square miles (900 km2) is land and 31 square miles (80 km2) (8.1%) is water.[4] It is the third-smallest county in Wisconsin by total area.
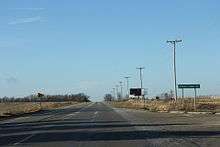
Major highways
Adjacent counties
- Waushara County – north
- Winnebago County – northeast
- Fond du Lac County – east
- Dodge County – southeast
- Columbia County – southwest
- Marquette County – west
Demographics
| Historical population | |||
|---|---|---|---|
| Census | Pop. | %± | |
| 1860 | 12,663 | — | |
| 1870 | 13,195 | 4.2% | |
| 1880 | 14,483 | 9.8% | |
| 1890 | 15,163 | 4.7% | |
| 1900 | 15,797 | 4.2% | |
| 1910 | 15,491 | −1.9% | |
| 1920 | 14,875 | −4.0% | |
| 1930 | 13,913 | −6.5% | |
| 1940 | 14,092 | 1.3% | |
| 1950 | 14,749 | 4.7% | |
| 1960 | 15,418 | 4.5% | |
| 1970 | 16,878 | 9.5% | |
| 1980 | 18,370 | 8.8% | |
| 1990 | 18,651 | 1.5% | |
| 2000 | 19,105 | 2.4% | |
| 2010 | 19,051 | −0.3% | |
| Est. 2016 | 18,719 | [5] | −1.7% |
| U.S. Decennial Census[6] 1790–1960[7] 1900–1990[8] 1990–2000[9] 2010–2014[1] | |||
As of the census[10] of 2000, there were 19,105 people, 7,703 households, and 5,322 families residing in the county. The population density was 54 people per square mile (21/km²). There were 9,831 housing units at an average density of 28 per square mile (11/km²). The racial makeup of the county was 97.81% White, 0.15% Black or African American, 0.20% Native American, 0.31% Asian, 0.04% Pacific Islander, 0.89% from other races, and 0.60% from two or more races. 2.06% of the population were Hispanic or Latino of any race. 51.8% were of German, 10.6% Polish, 5.8% Irish and 5.8% American ancestry according to Census 2000. 94.2% spoke English, 3.0% Spanish and 1.8% German as their first language.
There were 7,703 households out of which 29.40% had children under the age of 18 living with them, 58.50% were married couples living together, 6.90% had a female householder with no husband present, and 30.90% were non-families. 27.00% of all households were made up of individuals and 13.80% had someone living alone who was 65 years of age or older. The average household size was 2.43 and the average family size was 2.96.
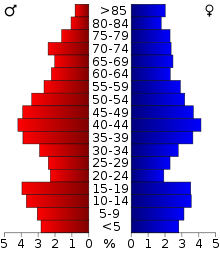
In the county, the population was spread out with 24.20% under the age of 18, 6.60% from 18 to 24, 26.20% from 25 to 44, 24.20% from 45 to 64, and 18.80% who were 65 years of age or older. The median age was 41 years. For every 100 females there were 97.00 males. For every 100 females age 18 and over, there were 95.20 males.
Communities
Cities
- Berlin (partly in Waushara County)
- Green Lake (county seat)
- Markesan
- Princeton
Villages
Towns
Census-designated place
Unincorporated communities
Politics
| Year | Republican | Democratic | Third parties |
|---|---|---|---|
| 2016 | 66.0% 6,216 | 28.6% 2,693 | 5.4% 507 |
| 2012 | 59.8% 5,782 | 39.2% 3,793 | 1.0% 100 |
| 2008 | 56.6% 5,393 | 42.0% 4,000 | 1.5% 143 |
| 2004 | 63.6% 6,472 | 35.4% 3,605 | 1.0% 101 |
| 2000 | 59.9% 5,451 | 36.3% 3,301 | 3.9% 355 |
| 1996 | 45.2% 3,565 | 40.0% 3,152 | 14.8% 1,165 |
| 1992 | 40.9% 3,897 | 29.1% 2,772 | 30.1% 2,871 |
| 1988 | 62.7% 5,205 | 36.6% 3,033 | 0.7% 61 |
| 1984 | 71.1% 6,198 | 28.0% 2,441 | 0.9% 77 |
| 1980 | 63.4% 5,868 | 30.8% 2,851 | 5.8% 533 |
| 1976 | 58.4% 5,020 | 39.7% 3,411 | 1.9% 164 |
| 1972 | 67.7% 5,046 | 29.2% 2,174 | 3.2% 237 |
| 1968 | 63.7% 4,893 | 29.9% 2,299 | 6.4% 491 |
| 1964 | 49.8% 3,871 | 50.1% 3,893 | 0.1% 4 |
| 1960 | 64.7% 5,110 | 35.2% 2,776 | 0.1% 7 |
| 1956 | 76.5% 5,441 | 23.1% 1,643 | 0.4% 29 |
| 1952 | 79.3% 6,117 | 20.6% 1,590 | 0.1% 10 |
| 1948 | 68.8% 3,939 | 30.1% 1,722 | 1.2% 68 |
| 1944 | 67.4% 4,571 | 32.3% 2,190 | 0.3% 23 |
| 1940 | 67.3% 4,919 | 32.2% 2,357 | 0.5% 38 |
| 1936 | 42.6% 2,926 | 55.8% 3,840 | 1.6% 111 |
| 1932 | 32.6% 2,179 | 66.5% 4,446 | 0.9% 58 |
| 1928 | 53.2% 3,038 | 45.9% 2,622 | 1.0% 56 |
| 1924 | 37.5% 1,988 | 20.5% 1,090 | 42.0% 2,231 |
| 1920 | 75.5% 3,467 | 19.4% 890 | 5.1% 233 |
| 1916 | 53.5% 1,647 | 43.9% 1,352 | 2.6% 81 |
| 1912 | 42.5% 1,269 | 47.2% 1,407 | 10.3% 308 |
| 1908 | 55.2% 2,094 | 42.4% 1,608 | 2.5% 95 |
| 1904 | 60.9% 2,181 | 35.5% 1,269 | 3.6% 130 |
| 1900 | 56.4% 2,081 | 41.3% 1,522 | 2.3% 86 |
| 1896 | 55.7% 2,103 | 41.5% 1,568 | 2.8% 105 |
| 1892 | 42.6% 1,430 | 53.9% 1,810 | 3.5% 117 |
See also
References
| Wikimedia Commons has media related to Green Lake County, Wisconsin. |
- 1 2 "State & County QuickFacts". United States Census Bureau. Archived from the original on July 11, 2011. Retrieved January 18, 2014.
- ↑ "Find a County". National Association of Counties. Archived from the original on 2011-05-31. Retrieved 2011-06-07.
- ↑ "Centers of Population by State: 2010". United States Census Bureau. Archived from the original on January 3, 2014. Retrieved May 12, 2014.
- ↑ "2010 Census Gazetteer Files". United States Census Bureau. August 22, 2012. Retrieved August 4, 2015.
- ↑ "Population and Housing Unit Estimates". Retrieved June 9, 2017.
- ↑ "U.S. Decennial Census". United States Census Bureau. Archived from the original on May 12, 2015. Retrieved August 4, 2015.
- ↑ "Historical Census Browser". University of Virginia Library. Retrieved August 4, 2015.
- ↑ Forstall, Richard L., ed. (March 27, 1995). "Population of Counties by Decennial Census: 1900 to 1990". United States Census Bureau. Retrieved August 4, 2015.
- ↑ "Census 2000 PHC-T-4. Ranking Tables for Counties: 1990 and 2000" (PDF). United States Census Bureau. April 2, 2001. Retrieved August 4, 2015.
- ↑ "American FactFinder". United States Census Bureau. Archived from the original on 2013-09-11. Retrieved 2011-05-14.
- ↑ Leip, David. "Dave Leip's Atlas of U.S. Presidential Elections". uselectionatlas.org. Retrieved 2018-05-07.
Further reading
- Portrait and Biographical Album of Green Lake, Marquette and Waushara Counties, Wisconsin. Chicago: Acme Publishing, 1890.
External links
- Green Lake County government website
- Green Lake County map from the Wisconsin Department of Transportation
Places adjacent to Green Lake County, Wisconsin | ||||||||||
|---|---|---|---|---|---|---|---|---|---|---|
| ||||||||||
Municipalities and communities of Green Lake County, Wisconsin, United States | ||
|---|---|---|
| Cities | | |
| Villages | ||
| Towns | ||
| CDP | ||
| Unincorporated communities | ||
| Footnotes | ‡This populated place also has portions in an adjacent county or counties | |