Dunn County, Wisconsin
| Dunn County, Wisconsin | ||
|---|---|---|
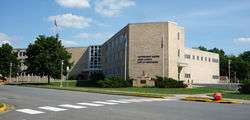 Dunn County Government Center, Menomonie | ||
| ||
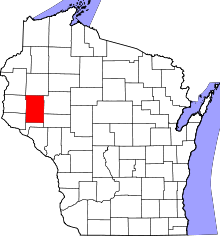 Location in the U.S. state of Wisconsin | ||
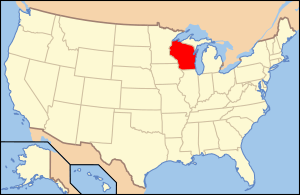 Wisconsin's location in the U.S. | ||
| Founded | 1857 | |
| Named for | Charles Dunn | |
| Seat | Menomonie | |
| Largest city | Menomonie | |
| Area | ||
| • Total | 864 sq mi (2,238 km2) | |
| • Land | 850 sq mi (2,201 km2) | |
| • Water | 14 sq mi (36 km2), 1.6% | |
| Population | ||
| • (2010) | 43,857 | |
| • Density | 52/sq mi (20/km2) | |
| Congressional district | 3rd | |
| Time zone | Central: UTC−6/−5 | |
| Website |
www | |

Dunn County is a county in the U.S. state of Wisconsin. As of the 2010 census, the population was 43,857.[1] Its county seat is Menomonie.[2]
Dunn County comprises the Menomonie, WI Micropolitan Statistical Area and is included in the Eau Claire-Menomonie, WI Combined Statistical Area.
History
The county was founded in 1854 from Chippewa County and organized in 1857.[3][4][5] It is named for Charles Dunn, first chief justice of the territory.[6]
Geography
According to the U.S. Census Bureau, the county has a total area of 864 square miles (2,240 km2), of which 850 square miles (2,200 km2) is land and 14 square miles (36 km2) (1.6%) is water.[7]
Adjacent counties
- Barron County - north
- Chippewa County - east
- Eau Claire County - southeast
- Pepin County - south
- Pierce County - southwest
- Polk County - northwest
- Saint Croix County - west
Major highways
Airports
- Menomonie Municipal Airport (KLUM) serves the county and surrounding communities.
- Boyceville Municipal Airport (3T3) enhances county service.
Demographics
| Historical population | |||
|---|---|---|---|
| Census | Pop. | %± | |
| 1860 | 2,704 | — | |
| 1870 | 9,488 | 250.9% | |
| 1880 | 16,817 | 77.2% | |
| 1890 | 22,664 | 34.8% | |
| 1900 | 25,043 | 10.5% | |
| 1910 | 25,260 | 0.9% | |
| 1920 | 26,970 | 6.8% | |
| 1930 | 27,037 | 0.2% | |
| 1940 | 27,375 | 1.3% | |
| 1950 | 27,341 | −0.1% | |
| 1960 | 26,156 | −4.3% | |
| 1970 | 29,154 | 11.5% | |
| 1980 | 34,314 | 17.7% | |
| 1990 | 35,909 | 4.6% | |
| 2000 | 39,858 | 11.0% | |
| 2010 | 43,857 | 10.0% | |
| Est. 2016 | 44,704 | [8] | 1.9% |
| U.S. Decennial Census[9] 1790–1960[10] 1900–1990[11] 1990–2000[12] 2010–2014[1] | |||
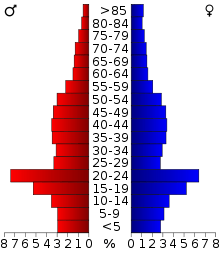
As of the census[13] of 2000, there were 39,858 people, 14,337 households, and 9,261 families residing in the county. The population density was 47 people per square mile (18/km²). There were 15,277 housing units at an average density of 18 per square mile (7/km²). The racial makeup of the county was 96.08% White, 0.34% Black or African American, 0.27% Native American, 2.13% Asian, 0.01% Pacific Islander, 0.37% from other races, and 0.80% from two or more races. 0.84% of the population were Hispanic or Latino of any race. 39.3% were of German, 22.6% Norwegian and 5.1% Irish ancestry according to Census 2000. 95.7% spoke English, 1.6% Spanish and 1.5% Hmong as their first language.
There were 14,337 households out of which 31.40% had children under the age of 18 living with them, 54.10% were married couples living together, 6.90% had a female householder with no husband present, and 35.40% were non-families. 24.40% of all households were made up of individuals and 9.00% had someone living alone who was 65 years of age or older. The average household size was 2.57 and the average family size was 3.07.
In the county, the population was spread out with 23.30% under the age of 18, 19.80% from 18 to 24, 25.70% from 25 to 44, 19.80% from 45 to 64, and 11.20% who were 65 years of age or older. The median age was 31 years. For every 100 females there were 101.70 males. For every 100 females age 18 and over, there were 102.20 males.
Communities
City
Villages
Towns
Census-designated places
Unincorporated communities
Ghost towns/neighborhoods
Politics
| Year | Republican | Democratic | Third parties |
|---|---|---|---|
| 2016 | 52.0% 11,486 | 40.9% 9,034 | 7.2% 1,586 |
| 2012 | 46.5% 10,224 | 51.5% 11,316 | 2.1% 452 |
| 2008 | 41.6% 9,566 | 56.6% 13,002 | 1.8% 421 |
| 2004 | 47.0% 10,879 | 52.0% 12,039 | 1.1% 254 |
| 2000 | 46.1% 8,911 | 47.5% 9,172 | 6.5% 1,247 |
| 1996 | 31.9% 4,917 | 48.9% 7,536 | 19.2% 2,962 |
| 1992 | 29.0% 5,283 | 43.7% 7,965 | 27.3% 4,970 |
| 1988 | 43.8% 7,273 | 55.5% 9,205 | 0.7% 116 |
| 1984 | 51.8% 8,473 | 47.2% 7,712 | 1.1% 173 |
| 1980 | 43.5% 7,428 | 45.3% 7,743 | 11.2% 1,917 |
| 1976 | 45.0% 6,751 | 52.5% 7,882 | 2.5% 371 |
| 1972 | 53.0% 6,660 | 45.3% 5,681 | 1.7% 215 |
| 1968 | 51.4% 5,415 | 41.7% 4,392 | 6.8% 719 |
| 1964 | 37.9% 3,964 | 61.9% 6,475 | 0.2% 19 |
| 1960 | 59.8% 6,723 | 39.9% 4,487 | 0.3% 29 |
| 1956 | 60.4% 6,401 | 39.5% 4,189 | 0.1% 14 |
| 1952 | 67.4% 7,475 | 32.4% 3,593 | 0.2% 26 |
| 1948 | 46.0% 4,319 | 52.2% 4,894 | 1.8% 169 |
| 1944 | 60.4% 5,980 | 38.9% 3,853 | 0.7% 72 |
| 1940 | 59.9% 6,968 | 39.1% 4,545 | 1.1% 126 |
| 1936 | 41.6% 4,570 | 51.2% 5,619 | 7.2% 786 |
| 1932 | 42.8% 3,898 | 54.2% 4,936 | 3.0% 274 |
| 1928 | 76.5% 7,096 | 22.1% 2,045 | 1.4% 133 |
| 1924 | 40.1% 3,177 | 3.6% 284 | 56.3% 4,455 |
| 1920 | 87.9% 5,596 | 7.7% 491 | 4.4% 283 |
| 1916 | 60.0% 2,556 | 34.0% 1,447 | 6.0% 254 |
| 1912 | 37.5% 1,403 | 22.2% 833 | 40.3% 1,510[15] |
| 1908 | 74.4% 3,297 | 20.6% 914 | 5.0% 221 |
| 1904 | 81.3% 3,303 | 13.4% 546 | 5.3% 216 |
| 1900 | 70.8% 3,046 | 25.8% 1,110 | 3.4% 147 |
| 1896 | 67.9% 3,370 | 28.6% 1,418 | 3.5% 172 |
| 1892 | 50.9% 2,169 | 29.5% 1,257 | 19.6% 833 |
See also
References
- 1 2 "State & County QuickFacts". United States Census Bureau. Archived from the original on July 9, 2011. Retrieved January 18, 2014.
- ↑ "Find a County". National Association of Counties. Archived from the original on 2012-07-12. Retrieved 2011-06-07.
- ↑ Wisconsin Blue Book 1991-1992, p. 731; cited there as from "Wisconsin Historical Records, Origin and Legislative History of County Boundaries in Wisconsin, 1942."
- ↑ When Counties Originated from rootsweb.com's Oconto County, Wisconsin webpage Archived 2007-03-29 at the Wayback Machine..
- ↑ "Wisconsin: Individual County Chronologies". Wisconsin Atlas of Historical County Boundaries. The Newberry Library. 2007. Retrieved August 13, 2015.
- ↑ Gannett, Henry (1905). The Origin of Certain Place Names in the United States. Govt. Print. Off. p. 110.
- ↑ "2010 Census Gazetteer Files". United States Census Bureau. August 22, 2012. Retrieved August 4, 2015.
- ↑ "Population and Housing Unit Estimates". Retrieved June 9, 2017.
- ↑ "U.S. Decennial Census". United States Census Bureau. Archived from the original on May 12, 2015. Retrieved August 4, 2015.
- ↑ "Historical Census Browser". University of Virginia Library. Retrieved August 4, 2015.
- ↑ Forstall, Richard L., ed. (March 27, 1995). "Population of Counties by Decennial Census: 1900 to 1990". United States Census Bureau. Retrieved August 4, 2015.
- ↑ "Census 2000 PHC-T-4. Ranking Tables for Counties: 1990 and 2000" (PDF). United States Census Bureau. April 2, 2001. Retrieved August 4, 2015.
- ↑ "American FactFinder". United States Census Bureau. Archived from the original on 2013-09-11. Retrieved 2011-05-14.
- ↑ Leip, David. "Dave Leip's Atlas of U.S. Presidential Elections". uselectionatlas.org. Retrieved 2018-05-07.
- ↑ The leading "other" candidate, Progressive Theodore Roosevelt, received 1,174 votes, while Socialist candidate Eugene Debs received 235 votes, Prohibition candidate Eugene Chafin received 94 votes, and Independent candidate Arthur Reimer received 7 votes.
External links
- Dunn County, Wisconsin website
- Dunn County Historical Society
- Dunn County map from the Wisconsin Department of Transportation
Places adjacent to Dunn County, Wisconsin | ||||||||||
|---|---|---|---|---|---|---|---|---|---|---|
| ||||||||||
Municipalities and communities of Dunn County, Wisconsin, United States | ||
|---|---|---|
| City | | |
| Villages | ||
| Towns | ||
| CDPs | ||
| Unincorporated communities | ||
| Ghost towns/neighborhoods | ||
| Footnote | ‡This populated place also has portions in an adjacent county or counties | |