Milwaukee County, Wisconsin
| Milwaukee County, Wisconsin | |||
|---|---|---|---|
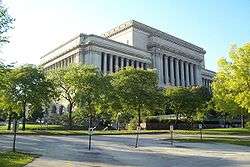 Milwaukee County Courthouse | |||
| |||
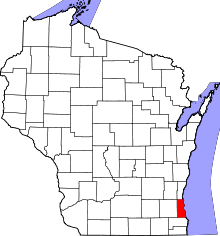 Location in the U.S. state of Wisconsin | |||
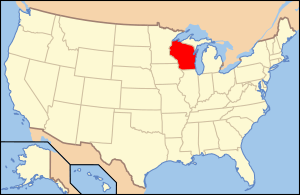 Wisconsin's location in the U.S. | |||
| Founded | 1835 | ||
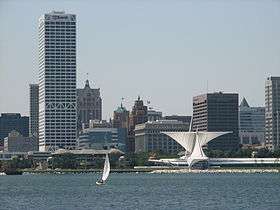
| Seat | Milwaukee | ||
| Largest city | Milwaukee | ||
| Area | |||
| • Total | 1,189 sq mi (3,079 km2) | ||
| • Land | 241 sq mi (624 km2) | ||
| • Water | 948 sq mi (2,455 km2), 80% | ||
| Population (est.) | |||
| • (2016) | 951,448 | ||
| • Density | 3,968/sq mi (1,532/km2) | ||
| Congressional districts | 1st, 4th, 5th, 6th | ||
| Time zone | Central: UTC−6/−5 | ||
| Website |
county | ||


Milwaukee County is a county in the U.S. state of Wisconsin. As of the 2010 census, the population was 947,735 and was estimated to be 951,448 in 2016.[1] It is the most populous county in Wisconsin and the 45th most populous in the United States. Its county seat is Milwaukee,[2] which is also the most populous city in the state. The county was created in 1834 as part of Michigan Territory and organized the following year.[3]
Milwaukee County is the most populous county of the Milwaukee-Waukesha-West Allis, WI Metropolitan Statistical Area, as well as of the Milwaukee-Racine-Waukesha, WI Combined Statistical Area.
There are 19 cities in Milwaukee County. The largest being Milwaukee, West Allis, Wauwatosa, Oak Creek, and Greenfield in that order.
Milwaukee County is the most densely populated county, that ranks in the top 50 most populated, when excluding Philadelphia and New York Burroughs from the list.
The county is home to two pro sports teams, and the world's largest music festival.
History
Portions of what is now Milwaukee County are known to have been inhabited by a number of Native American tribes, including the Sauk, Meskwaki or "Fox", Menomonee, Ojibwe and Potawotami, with elements of other tribes attested as well.[4]
In 1818, when the land later to be Wisconsin was made part of Michigan Territory, territorial governor Lewis Cass created Brown County, which at that time included all the land now part of Milwaukee County. It remained a part of Brown county until 1834, when Milwaukee County was created, including the area south of the line between townships eleven and twelve north (i.e., the northern boundary of Washington and Ozaukee counties), west of Lake Michigan, north of Illinois, and east of the line which now separates Green and Rock counties. This territory encompassed all of what are now Milwaukee, Jefferson, Kenosha, Ozaukee, Racine, Rock, Walworth, Washington, and Waukesha counties, as well as large parts of the present-day Columbia, Dane and Dodge counties.
Milwaukee County remained attached to Brown County for judicial purposes until Aug. 25, 1835, when an act was passed by the Michigan territorial legislature giving it an independent organization. In 1836, the legislature divided the area south and east of the Wisconsin and Fox rivers into counties, as a consequence reducing Milwaukee County's extent to what is now Milwaukee and Waukesha counties. In 1846 Waukesha County was created by taking from Milwaukee all of the territory west of range 21, reducing Milwaukee County to its present boundaries.[5]
Geography
According to the U.S. Census Bureau, the county has a total area of 1,189 square miles (3,080 km2), of which 241 square miles (620 km2) is land and 948 square miles (2,460 km2) (80%) is water.[6] It is the third-smallest county in Wisconsin by land area. It is watered by the Milwaukee, Menomonee, Kinnickinnic, and Root Rivers. The surface is undulating, and the soil calcareous and fertile.[7]
Adjacent counties
- Ozaukee County - north
- Racine County - south
- Waukesha County - west
- Washington County - northwest
- Lake Michigan - east
Demographics

| Historical population | |||
|---|---|---|---|
| Census | Pop. | %± | |
| 1850 | 31,077 | — | |
| 1860 | 62,518 | 101.2% | |
| 1870 | 89,930 | 43.8% | |
| 1880 | 138,537 | 54.0% | |
| 1890 | 236,101 | 70.4% | |
| 1900 | 330,017 | 39.8% | |
| 1910 | 433,187 | 31.3% | |
| 1920 | 539,449 | 24.5% | |
| 1930 | 725,263 | 34.4% | |
| 1940 | 766,885 | 5.7% | |
| 1950 | 871,047 | 13.6% | |
| 1960 | 1,036,041 | 18.9% | |
| 1970 | 1,054,063 | 1.7% | |
| 1980 | 964,988 | −8.5% | |
| 1990 | 959,275 | −0.6% | |
| 2000 | 940,164 | −2.0% | |
| 2010 | 947,735 | 0.8% | |
| Est. 2017 | 952,085 | [8] | 0.5% |
| U.S. Decennial Census[9] 1790–1960[10] 1900–1990[11] 1990–2000[12] 2010–2014[1] | |||
2010 census
As of the 2010 census,[13] there were 947,735 people, 383,591 households, and 221,019 families residing in the county. The population density was 3,932 people per square mile (1,528/km²). There were 418,053 housing units at an average density of 1,734 per square mile (674/km²). The racial makeup of the county was 60.6% White, 26.8% Black or African American, 0.7% Native American, 3.4% Asian, 0.003% Pacific Islander, 5.4% from other races, and 3.0% from two or more races. 13.3% of the population were Hispanic or Latino of any race.
There were 383,591 households, of which 28.0% had children under the age of 18 living with them, 35.1% were married couples living together, 17.4% had a female householder with no husband present, and 42.4% were non-families. 33.7% of all households were made up of individuals and 10.1% had someone living alone who was 65 years of age or older. The average household size was 2.41 and the average family size was 3.14.
In the county, the age distribution was spread out, with 24.9% under the age of 18, 11.4% from 18 to 24, 28.1% from 25 to 44, 24.1% from 45 to 64, and 11.5% who were 65 years of age or older. The median age was 33.6 years. For every 100 females there were 93.4 males. For every 100 females age 18 and over, there were 90.2 males.
2000 census
As of the 2000 census,[13] there were 940,164 people, 377,729 households and 225,126 families resided in the county. The population density was 3,931 people per square mile (1,503/km²). There were 400,093 housing units at an average density of 1,656 per square mile (640/km²). The racial makeup of the county was 65.6% White, 24.6% Black or African American, 0.7% Native American, 2.6% Asian, 0.04% Pacific Islander, 4.2% from other races, and 2.2% from two or more races. 8.8% of the population were Hispanic or Latino of any race. 25.0% were of German, 10.9% Polish and 5.3% Irish ancestry.
There were 377,729 households, of which 29.5% had children under the age of 18 living with them, 39.0% were married couples living together, 16.3% had a female householder with no husband present, and 40.4% were non-families. 33.0% of all households were made up of individuals and 10.7% had someone living alone who was 65 years of age or older. The average household size was 2.43 and the average family size was 3.13.
In the county, the age distribution was spread out, with 26.4% under the age of 18, 10.5% from 18 to 24, 30.3% from 25 to 44, 20.0% from 45 to 64, and 12.9% who were 65 years of age or older. The median age was 34 years. For every 100 females there were 92.0 males. For every 100 females age 18 and over, there were 88.1 males.
According to the U.S. Census Bureau, from 1980 to 2000, the residential pattern of Blacks versus Whites in Milwaukee County was the most segregated in the country.[14]
Government
Milwaukee County is governed through an eighteen-member Board of Supervisors and by an elected county executive. County supervisors, the county executive, and the county comptroller run in nonpartisan elections while other countywide officials, such as the district attorney and sheriff, run in partisan elections.
Politics
Milwaukee County is a Democratic stronghold, having voted for the Democratic presidential nominee since 1960, and all but three times since 1912.
| Year | Republican | Democratic | Third parties |
|---|---|---|---|
| 2016 | 28.6% 126,069 | 65.5% 288,822 | 5.9% 26,162 |
| 2012 | 31.5% 154,924 | 67.5% 332,438 | 1.1% 5,214 |
| 2008 | 31.5% 149,445 | 67.3% 319,819 | 1.3% 5,928 |
| 2004 | 37.4% 180,287 | 61.7% 297,653 | 0.9% 4,296 |
| 2000 | 37.7% 163,491 | 58.2% 252,329 | 4.1% 17,717 |
| 1996 | 32.2% 119,407 | 58.3% 216,620 | 9.5% 35,353 |
| 1992 | 32.5% 151,314 | 50.6% 235,521 | 16.9% 78,661 |
| 1988 | 38.3% 168,363 | 61.0% 268,287 | 0.7% 2,895 |
| 1984 | 42.9% 196,290 | 56.6% 259,144 | 0.6% 2,583 |
| 1980 | 39.5% 183,450 | 51.8% 240,174 | 8.7% 40,384 |
| 1976 | 42.1% 192,008 | 54.8% 249,739 | 3.2% 14,413 |
| 1972 | 46.1% 191,874 | 50.6% 210,802 | 3.4% 14,001 |
| 1968 | 39.8% 160,022 | 51.3% 206,027 | 8.9% 35,887 |
| 1964 | 34.1% 149,962 | 65.7% 288,577 | 0.2% 920 |
| 1960 | 42.0% 187,067 | 57.8% 257,707 | 0.2% 1,033 |
| 1956 | 55.8% 227,253 | 43.5% 177,286 | 0.7% 2,779 |
| 1952 | 51.5% 219,477 | 48.0% 204,474 | 0.5% 2,055 |
| 1948 | 40.4% 138,672 | 54.7% 187,637 | 4.8% 16,601 |
| 1944 | 40.2% 142,448 | 57.9% 205,282 | 2.0% 7,100 |
| 1940 | 37.3% 131,120 | 59.8% 209,861 | 2.9% 10,216 |
| 1936 | 18.5% 54,811 | 74.6% 221,512 | 7.0% 20,635 |
| 1932 | 21.1% 54,693 | 65.6% 170,202 | 13.3% 34,493 |
| 1928 | 39.8% 82,025 | 53.7% 110,668 | 6.6% 13,544 |
| 1924 | 34.3% 50,730 | 9.8% 14,510 | 55.9% 82,789 |
| 1920 | 51.6% 73,410 | 17.9% 25,464 | 30.5% 43,437 |
| 1916 | 34.8% 27,831 | 43.5% 34,812 | 21.7% 17,368 |
| 1912 | 25.1% 17,877 | 38.8% 27,628 | 36.2% 25,797 |
| 1908 | 39.0% 28,625 | 35.4% 26,000 | 25.6% 18,831 |
| 1904 | 46.2% 32,587 | 26.3% 18,560 | 27.5% 19,365 |
| 1900 | 52.5% 34,790 | 38.6% 25,596 | 8.8% 5,857 |
| 1896 | 55.9% 35,939 | 41.2% 26,536 | 2.9% 1,869 |
| 1892 | 48.2% 24,602 | 48.2% 24,607 | 3.5% 1,799 |
However, there have been some notable exceptions. Former County Sheriff David Clarke, while elected as a Democrat, was initially appointed by a Republican governor, considers himself nonpartisan, and has espoused politically conservative positions. Former County Executive Scott Walker was a Republican member of the Wisconsin State Assembly before being elected county executive in a 2002 special election and elected to full terms in 2004 and 2008, though the office of county executive is nonpartisan. Also, former Governor Tommy Thompson, a Republican, won Milwaukee County in his 1994 and 1998 reelection campaigns--to date, the last time a statewide Republican candidate won the county.
Transportation
Bus service in Milwaukee County is provided by the Milwaukee County Transit System, which operates 469 New Flyer and 5 Gillig Low Floor buses on 56 routes.
Airports
- General Mitchell International Airport (KMKE) is located in Milwaukee and serves the entire metropolitan area. It has scheduled service to cities across the United States as well as Canada and Mexico.
- Lawrence J. Timmerman Airport (KMWC) also serves the county and surrounding communities.
Major highways
Communities
Cities
Villages
Former towns/neighborhoods
See also
References
- 1 2 "State & County QuickFacts". United States Census Bureau. Archived from the original on July 14, 2011. Retrieved August 6, 2015.
- ↑ "Find a County". National Association of Counties. Retrieved 2011-06-07.
- ↑ "Wisconsin: Individual County Chronologies". Wisconsin Atlas of Historical County Boundaries. The Newberry Library. 2007. Retrieved August 15, 2015.
- ↑ Watrous, Jerome A. (ed.). Memoirs of Milwaukee County from the Earliest Historical Times Down to the Present. Madison, Wis.: Western Historical Association, 1909. Vol. 1; Vol. 2, pp. 28-37.
- ↑ Watrous, Jerome A. (ed.). Memoirs of Milwaukee County from the Earliest Historical Times Down to the Present. Madison, Wis.: Western Historical Association, 1909. Vol. 1; Vol. 2, pp. 45-46.
- ↑ "2010 Census Gazetteer Files". United States Census Bureau. August 22, 2012. Retrieved August 6, 2015.
- ↑

- ↑ "Population and Housing Unit Estimates". Retrieved June 9, 2017.
- ↑ "U.S. Decennial Census". United States Census Bureau. Retrieved August 6, 2015.
- ↑ "Historical Census Browser". University of Virginia Library. Retrieved August 6, 2015.
- ↑ Forstall, Richard L., ed. (March 27, 1995). "Population of Counties by Decennial Census: 1900 to 1990". United States Census Bureau. Retrieved August 6, 2015.
- ↑ "Census 2000 PHC-T-4. Ranking Tables for Counties: 1990 and 2000" (PDF). United States Census Bureau. April 2, 2001. Retrieved August 6, 2015.
- 1 2 "American FactFinder". United States Census Bureau. Retrieved 2011-05-14.
- ↑ "Housing Patterns - Cover Page, Publication Information, and Table of Contents". www.census.gov. Retrieved 31 March 2018.
- ↑ Leip, David. "Dave Leip's Atlas of U.S. Presidential Elections". uselectionatlas.org. Retrieved 31 March 2018.
External links
- Milwaukee County government website
- Milwaukee County map from the Wisconsin Department of Transportation
- Milwaukee County Transit System
Places adjacent to Milwaukee County, Wisconsin | ||||||||||
|---|---|---|---|---|---|---|---|---|---|---|
| ||||||||||
| Central city | 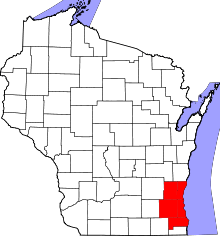 | |
|---|---|---|
| Largest municipalities (over 25,000 in 2010) | ||
| Municipalities (over 10,000 in 2010) | ||
| Smaller municipalities (under 10,000 in 2010) | ||
| Counties | ||
Municipalities and communities of Milwaukee County, Wisconsin, United States | ||
|---|---|---|
| Cities | | |
| Villages | ||
| Ghost towns/ neighborhoods | ||
| Indian reservation | ||
| Footnotes | ‡This populated place also has portions in another county or counties | |