Waupaca County, Wisconsin
| Waupaca County, Wisconsin | |
|---|---|
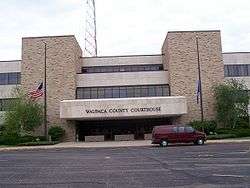 Waupaca County Courthouse | |
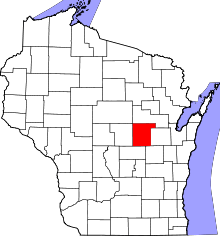 Location in the U.S. state of Wisconsin | |
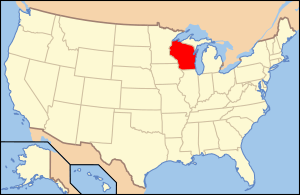 Wisconsin's location in the U.S. | |
| Founded | 1853 |
| Seat | Waupaca |
| Largest city | New London |
| Area | |
| • Total | 765 sq mi (1,981 km2) |
| • Land | 748 sq mi (1,937 km2) |
| • Water | 17 sq mi (44 km2), 2.3% |
| Population | |
| • (2010) | 52,410 |
| • Density | 70/sq mi (30/km2) |
| Congressional district | 8th |
| Time zone | Central: UTC−6/−5 |
| Website |
www |
Waupaca County is a county in the U.S. state of Wisconsin. As of the 2010 census, the population was 52,410.[1] The county seat is Waupaca.[2] The county was created in 1851 and organized in 1853.[3] It is named after the Waupaca River, a Menominee language name meaning 'white sand bottom', 'pale water', or 'tomorrow river'.[4][5]
History
Ancient indigenous peoples constructed earthworks that expressed their religious and political concepts. An early European explorer counted 72 such earthen mounds in what is now Waupaca County, many of them in the form of effigy mounds, shaped like "humans, turtles, catfish and others."[6] There were 52 mounds constructed around what is now called Taylor Lake. Most mounds were lost to agricultural development. One mound, shaped like a catfish, is still visible in a private yard along County Hwy. QQ, just east of Taylor Lake. The site was marked by a local women's club with a commemorative plaque installed on a large stone.[6]
Under pressure from European-American development, the Menominee people ceded their title to the United States for these lands by treaty in 1852. Following that, the flow of new migrant settlers greatly increased from the East, with people moving from New England, New York, and Ohio. They developed the land primarily for agricultural use in the early decades, also quickly establishing sawmills on the rivers.
In the 1870s railroads were constructed in the county: the Wisconsin Central in 1872 and the Green Bay and Minnesota Railroad (later known as Green Bay, Minnesota & St. Paul) in 1873. These improved the county's connections to markets for its lumber and other products. For a period, entrepreneurs and merchants gained high profits from the lumber industry, establishing many fine homes in the larger cities.
Geography
According to the U.S. Census Bureau, the county has a total area of 765 square miles (1,980 km2), of which 748 square miles (1,940 km2) is land and 17 square miles (44 km2) (2.3%) is water.[7] The water includes 43-acre Taylor Lake, one of a chain of lakes in the county. It has bluegill, brook trout, largemouth bass, muskellunge (muskie), Northern Pike, Tiger Muskellunge (Tiger Muskie) and Walleye fish.
Major highways
Airports
- KCLI - Clintonville Municipal Airport
- KPCZ - Waupaca Municipal Airport
Adjacent counties
- Shawano County - north
- Outagamie County - east
- Winnebago County - southeast
- Waushara County - southwest
- Portage County - west
- Marathon County - northwest
Demographics

| Historical population | |||
|---|---|---|---|
| Census | Pop. | %± | |
| 1860 | 8,851 | — | |
| 1870 | 15,539 | 75.6% | |
| 1880 | 20,955 | 34.9% | |
| 1890 | 26,794 | 27.9% | |
| 1900 | 31,615 | 18.0% | |
| 1910 | 32,782 | 3.7% | |
| 1920 | 34,200 | 4.3% | |
| 1930 | 33,513 | −2.0% | |
| 1940 | 34,614 | 3.3% | |
| 1950 | 35,056 | 1.3% | |
| 1960 | 35,340 | 0.8% | |
| 1970 | 37,780 | 6.9% | |
| 1980 | 42,831 | 13.4% | |
| 1990 | 46,104 | 7.6% | |
| 2000 | 51,731 | 12.2% | |
| 2010 | 52,410 | 1.3% | |
| Est. 2016 | 51,533 | [8] | −1.7% |
| U.S. Decennial Census[9] 1790–1960[10] 1900–1990[11] 1990–2000[12] 2010–2014[1] | |||
As of the census[13] of 2000, there were 51,731 people, 19,863 households, and 13,884 families residing in the county. The population density was 69 per square mile (27/km2). There were 22,508 housing units at an average density of 30 per square mile (12/km2). The racial makeup of the county was 97.93% White, 0.17% Black or African American, 0.42% Native American, 0.27% Asian, 0.01% Pacific Islander, 0.54% from other races, and 0.66% from two or more races. 1.38% of the population were Hispanic or Latino of any race. 53.1% were of German, 8.5% Norwegian and 6.8% Irish ancestry according to Census 2000. 96.6% spoke English, 1.4% Spanish and 1.3% German as their first language.
There were 19,863 households out of which 32.60% had children under the age of 18 living with them, 58.40% were married couples living together, 7.40% had a female householder with no husband present, and 30.10% were non-families. 25.20% of all households were made up of individuals and 11.70% had someone living alone who was 65 years of age or older. The average household size was 2.51 and the average family size was 3.01.
By age, 25.70% of the population was under 18, 7.10% from 18 to 24, 27.80% from 25 to 44, 22.70% from 45 to 64, and 16.70% who were 65 or older. The median age was 38 years. For every 100 females there were 100.30 males. For every 100 females age 18 and over, there were 98.40 males.
Government
County offices
- County board chairman - Dick Koeppen
- Vice Chair - Jim Loughrin
- County clerk - Mary Robbins
- County sheriff - Brad Hardel
Politics
| Year | Republican | Democratic | Third parties |
|---|---|---|---|
| 2016 | 62.1% 16,209 | 32.4% 8,451 | 5.5% 1,435 |
| 2012 | 54.2% 14,002 | 44.8% 11,578 | 1.0% 260 |
| 2008 | 48.0% 12,232 | 50.8% 12,952 | 1.3% 327 |
| 2004 | 59.1% 15,941 | 40.0% 10,792 | 0.9% 241 |
| 2000 | 56.9% 12,980 | 38.5% 8,787 | 4.5% 1,037 |
| 1996 | 45.1% 8,679 | 40.5% 7,800 | 14.4% 2,764 |
| 1992 | 44.3% 10,252 | 28.8% 6,666 | 27.0% 6,241 |
| 1988 | 61.6% 11,559 | 37.7% 7,078 | 0.6% 120 |
| 1984 | 68.3% 13,097 | 30.8% 5,895 | 0.9% 175 |
| 1980 | 61.7% 12,568 | 31.4% 6,401 | 6.9% 1,397 |
| 1976 | 60.1% 10,849 | 38.0% 6,857 | 1.9% 337 |
| 1972 | 70.1% 11,040 | 28.1% 4,418 | 1.8% 284 |
| 1968 | 67.1% 10,606 | 25.2% 3,978 | 7.7% 1,215 |
| 1964 | 54.5% 8,381 | 45.4% 6,990 | 0.1% 18 |
| 1960 | 72.6% 12,247 | 27.3% 4,606 | 0.1% 14 |
| 1956 | 78.6% 11,798 | 20.9% 3,133 | 0.5% 72 |
| 1952 | 81.4% 13,693 | 18.5% 3,105 | 0.2% 28 |
| 1948 | 67.5% 8,764 | 31.0% 4,020 | 1.5% 198 |
| 1944 | 74.4% 11,495 | 25.1% 3,879 | 0.4% 68 |
| 1940 | 70.0% 11,099 | 29.1% 4,616 | 1.0% 151 |
| 1936 | 45.9% 6,680 | 47.5% 6,920 | 6.6% 961 |
| 1932 | 37.5% 5,082 | 60.4% 8,179 | 2.0% 275 |
| 1928 | 72.3% 8,928 | 26.8% 3,307 | 0.9% 110 |
| 1924 | 33.9% 3,654 | 6.2% 665 | 59.9% 6,462 |
| 1920 | 83.0% 8,302 | 8.9% 888 | 8.1% 807 |
| 1916 | 69.9% 4,492 | 26.8% 1,720 | 3.4% 219 |
| 1912 | 37.7% 2,204 | 26.7% 1,563 | 35.6% 2,086 |
| 1908 | 71.9% 4,785 | 22.3% 1,483 | 5.8% 384 |
| 1904 | 81.3% 5,471 | 14.0% 942 | 4.7% 313 |
| 1900 | 76.3% 5,284 | 20.0% 1,383 | 3.7% 259 |
| 1896 | 75.2% 5,472 | 21.7% 1,577 | 3.2% 229 |
| 1892 | 57.2% 3,397 | 36.8% 2,186 | 5.9% 353 |
Communities

Cities
- Clintonville
- Manawa
- Marion (partly in Shawano County)
- New London (partly in Outagamie County)
- Waupaca (county seat)
- Weyauwega
Villages
Towns
Census-designated places
Unincorporated communities
Ghost towns/neighborhoods
See also
References
- 1 2 "State & County QuickFacts". United States Census Bureau. Retrieved January 24, 2014.
- ↑ "Find a County". National Association of Counties. Retrieved 2011-06-07.
- ↑ "Wisconsin: Individual County Chronologies". Wisconsin Atlas of Historical County Boundaries. The Newberry Library. 2007. Retrieved August 15, 2015.
- ↑ "Here's How Iron Got Its Name". The Rhinelander Daily News. June 16, 1932. p. 2. Retrieved August 24, 2014 – via Newspapers.com.

- ↑ "Winnebago Took Its Name from an Indian Tribe". The Post-Crescent. December 28, 1963. p. 14. Retrieved August 25, 2014 – via Newspapers.com.
- 1 2 Waupaca Area Chamber of Commerce
- ↑ "2010 Census Gazetteer Files". United States Census Bureau. August 22, 2012. Retrieved August 9, 2015.
- ↑ "Population and Housing Unit Estimates". Retrieved June 9, 2017.
- ↑ "U.S. Decennial Census". United States Census Bureau. Retrieved August 9, 2015.
- ↑ "Historical Census Browser". University of Virginia Library. Retrieved August 9, 2015.
- ↑ Forstall, Richard L., ed. (March 27, 1995). "Population of Counties by Decennial Census: 1900 to 1990". United States Census Bureau. Retrieved August 9, 2015.
- ↑ "Census 2000 PHC-T-4. Ranking Tables for Counties: 1990 and 2000" (PDF). United States Census Bureau. April 2, 2001. Retrieved August 9, 2015.
- ↑ "American FactFinder". United States Census Bureau. Retrieved 2011-05-14.
- ↑ Leip, David. "Dave Leip's Atlas of U.S. Presidential Elections". uselectionatlas.org. Retrieved 2018-08-14.
External links
Places adjacent to Waupaca County, Wisconsin | |
|---|---|
Municipalities and communities of Waupaca County, Wisconsin, United States | ||
|---|---|---|
| Cities | | |
| Villages | ||
| Towns | ||
| CDPs | ||
| Unincorporated communities | ||
| Ghost towns/neighborhoods | ||
| Footnotes | ‡This populated place also has portions in an adjacent county or counties | |