La Crosse County, Wisconsin
| La Crosse County, Wisconsin | ||
|---|---|---|
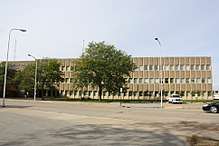 La Crosse County Administration Building | ||
| ||
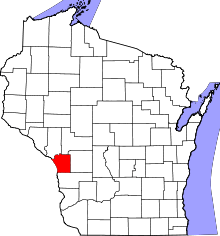 Location in the U.S. state of Wisconsin | ||
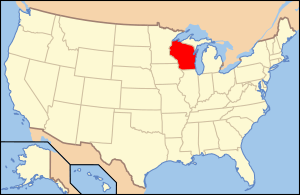 Wisconsin's location in the U.S. | ||
| Founded | 1851 | |
| Seat | La Crosse | |
| Largest city | La Crosse | |
| Area | ||
| • Total | 480 sq mi (1,243 km2) | |
| • Land | 452 sq mi (1,171 km2) | |
| • Water | 28 sq mi (73 km2), 5.9% | |
| Population | ||
| • (2010) | 114,638 | |
| • Density | 255/sq mi (98/km2) | |
| Congressional district | 3rd | |
| Time zone | Central: UTC−6/−5 | |
| Website |
www | |

La Crosse County is a county located in the U.S. state of Wisconsin. As of the 2010 census, the population was 114,638.[1] The 2017 estimate places the county's population at 118,274.[2] Its county seat is La Crosse.[3]
La Crosse County is included in the La Crosse-Onalaska, WI-MN Metropolitan Statistical Area and is the most populous county on Wisconsin's western border.
Geography
According to the U.S. Census Bureau, the county has a total area of 480 square miles (1,200 km2), of which 452 square miles (1,170 km2) is land and 28 square miles (73 km2) (5.9%) is water.[4]

Major highways
Airport
- KLSE - La Crosse Regional Airport
Adjacent counties
- Trempealeau County - northwest
- Jackson County - northeast
- Monroe County - east
- Vernon County - south
- Houston County, Minnesota - southwest
- Winona County, Minnesota - west
Demographics

| Historical population | |||
|---|---|---|---|
| Census | Pop. | %± | |
| 1860 | 12,186 | — | |
| 1870 | 20,297 | 66.6% | |
| 1880 | 27,073 | 33.4% | |
| 1890 | 38,801 | 43.3% | |
| 1900 | 42,997 | 10.8% | |
| 1910 | 43,996 | 2.3% | |
| 1920 | 44,355 | 0.8% | |
| 1930 | 54,455 | 22.8% | |
| 1940 | 59,653 | 9.5% | |
| 1950 | 67,587 | 13.3% | |
| 1960 | 72,465 | 7.2% | |
| 1970 | 80,468 | 11.0% | |
| 1980 | 91,056 | 13.2% | |
| 1990 | 97,904 | 7.5% | |
| 2000 | 107,120 | 9.4% | |
| 2010 | 114,638 | 7.0% | |
| Est. 2017 | 118,274 | [5] | 3.2% |
| U.S. Decennial Census[6] 1790–1960[7] 1900–1990[8] 1990–2000[9] 2010–2014[1] | |||
According to 2011–2013 ACS estimates, the median household income was $51,551 and the median family income was $67,388. Males had a median income of $41,437 versus $34,854 for females. The per capita income for the county was $26,065. About 9.1% of families and 15.9% of the population were below the poverty line, including 17.3% of those under age 18 and 7.3% of those age 65 or over.[10]
As of the census of 2010,[11] there were 114,638 people, 46,137 households, and 27,373 families residing in the county. The population density was 255 people per square mile (91/km²). There were 46,137 housing units at an average density of 96 per square mile (37/km²). The racial makeup of the county was 92.1% White, 1.4% Black or African American, 0.4% Native American, 4.1% Asian, 0.00% Pacific Islander, 0.3% from other races, and 1.6% from two or more races. 0.92% of the population were Hispanic or Latino of any race. 38.9% were of German, 20.3% Norwegian and 7.9% Irish ancestry. 94.8% spoke English, 1.8% Hmong and 1.7% Spanish as their first language.
There were 41,599 households out of which 29.90% had children under the age of 18 living with them, 50.00% were married couples living together, 8.40% had a female householder with no husband present, and 38.50% were non-families. 28.40% of all households were made up of individuals and 9.80% had someone living alone who was 65 years of age or older. The average household size was 2.45 and the average family size was 3.02.
In the county, the population was spread out with 23.60% under the age of 18, 15.60% from 18 to 24, 27.50% from 25 to 44, 20.80% from 45 to 64, and 12.50% who were 65 years of age or older. The median age was 34 years. For every 100 females there were 94.10 males. For every 100 females age 18 and over, there were 90.70 males.
Government
- County Chair: Tara Johnson (non-partisan)[12]
- District Attorney: Tim Gruenke (D)
- Sheriff: Steve Helgeson (R)
- County Clerk: Ginny Dankmeyer (D)
- County Treasurer: Shawn Handland (D)
- Register of Deeds: Cheryl McBride (R)
- Board of Supervisors: (35 members)[13]
- County Administrator: Steve O'Malley[14]
Politics
La Crosse County voted for the Democratic nominee in each presidential election since 1988.[15] In 2014, the Milwaukee Journal Sentinel ranked La Crosse County as one of Wisconsin's most Democratic counties.[16]
| Year | Republican | Democratic | Third parties |
|---|---|---|---|
| 2016 | 41.4% 26,378 | 50.9% 32,406 | 7.7% 4,890 |
| 2012 | 40.6% 25,751 | 57.8% 36,693 | 1.6% 1,018 |
| 2008 | 37.5% 23,701 | 60.9% 38,524 | 1.6% 993 |
| 2004 | 45.5% 28,289 | 53.4% 33,170 | 1.1% 677 |
| 2000 | 43.8% 24,327 | 51.2% 28,455 | 5.0% 2,777 |
| 1996 | 35.8% 16,482 | 51.4% 23,647 | 12.8% 5,872 |
| 1992 | 36.1% 18,891 | 43.7% 22,838 | 20.2% 10,544 |
| 1988 | 48.9% 21,548 | 50.4% 22,204 | 0.7% 314 |
| 1984 | 58.8% 25,721 | 40.6% 17,787 | 0.6% 261 |
| 1980 | 51.7% 23,427 | 38.2% 17,304 | 10.1% 4,554 |
| 1976 | 58.1% 24,188 | 40.0% 16,674 | 1.9% 797 |
| 1972 | 63.3% 21,992 | 35.0% 12,152 | 1.7% 602 |
| 1968 | 55.8% 17,433 | 37.0% 11,570 | 7.2% 2,264 |
| 1964 | 44.1% 13,135 | 55.8% 16,625 | 0.1% 43 |
| 1960 | 56.1% 18,319 | 43.8% 14,310 | 0.1% 36 |
| 1956 | 61.7% 18,264 | 38.0% 11,258 | 0.3% 100 |
| 1952 | 61.9% 19,271 | 37.9% 11,808 | 0.2% 53 |
| 1948 | 45.3% 10,525 | 53.1% 12,345 | 1.7% 390 |
| 1944 | 50.9% 12,784 | 48.8% 12,247 | 0.3% 72 |
| 1940 | 50.9% 13,711 | 48.6% 13,079 | 0.5% 134 |
| 1936 | 33.1% 7,558 | 63.3% 14,455 | 3.6% 827 |
| 1932 | 36.9% 7,686 | 62.1% 12,919 | 1.0% 200 |
| 1928 | 55.8% 11,321 | 43.7% 8,877 | 0.5% 97 |
| 1924 | 32.5% 5,733 | 7.1% 1,252 | 60.4% 10,662 |
| 1920 | 74.0% 10,067 | 19.0% 2,588 | 7.0% 956 |
| 1916 | 44.4% 3,597 | 50.9% 4,123 | 4.8% 386 |
| 1912 | 28.3% 2,272 | 53.1% 4,263 | 18.7% 1,498 |
| 1908 | 50.2% 4,382 | 46.4% 4,054 | 3.5% 301 |
| 1904 | 61.8% 5,506 | 34.7% 3,089 | 3.6% 320 |
| 1900 | 58.2% 5,324 | 39.5% 3,609 | 2.3% 208 |
| 1896 | 64.6% 6,297 | 31.4% 3,058 | 4.1% 396 |
| 1892 | 42.9% 3,693 | 44.2% 3,810 | 12.9% 1,110 |
Communities
Cities
Villages
Towns
Census-designated places
- Brice Prairie, part of the Town of Onalaska and an urban reserve area of the City of Onalaska
- French Island
- St. Joseph
Unincorporated communities
Notable people
- Ed Gein - grave robber who inspired Psycho, The Silence of the Lambs, and Texas Chainsaw Massacre.[18]
See also
References
- 1 2 "State & County QuickFacts". United States Census Bureau. Archived from the original on July 13, 2011. Retrieved January 21, 2014.
- ↑ "Archived copy". Archived from the original on 2018-04-17. Retrieved 2018-08-06.
- ↑ "Find a County". National Association of Counties. Retrieved 2011-06-07.
- ↑ "2010 Census Gazetteer Files". United States Census Bureau. August 22, 2012. Retrieved August 5, 2015.
- ↑ "Population and Housing Unit Estimates". Retrieved June 9, 2018.
- ↑ "U.S. Decennial Census". United States Census Bureau. Retrieved August 5, 2015.
- ↑ "Historical Census Browser". University of Virginia Library. Retrieved August 5, 2015.
- ↑ Forstall, Richard L., ed. (March 27, 1995). "Population of Counties by Decennial Census: 1900 to 1990". United States Census Bureau. Retrieved August 5, 2015.
- ↑ "Census 2000 PHC-T-4. Ranking Tables for Counties: 1990 and 2000" (PDF). United States Census Bureau. April 2, 2001. Retrieved August 5, 2015.
- ↑ http://factfinder.census.gov/faces/tableservices/jsf/pages/productview.xhtml?pid=ACS_13_1YR_DP03&prodType=table
- ↑ "American FactFinder". United States Census Bureau. Retrieved 2011-05-14.
- ↑ http://lacrossetribune.com/news/local/govt-and-politics/article_67d9067c-b3f1-11e0-9209-001cc4c03286.html
- ↑ http://www.co.la-crosse.wi.us/CoDirctry/2SupervDist.pdf
- ↑ http://www.co.la-crosse.wi.us/departments/admin%20coord/
- ↑ "Official Summary 2012 November General". Retrieved December 14, 2017.
- ↑ http://www.jsonline.com/blogs/news/284675921.html
- ↑ Leip, David. "Dave Leip's Atlas of U.S. Presidential Elections". uselectionatlas.org. Retrieved 2018-08-14.
- ↑ "Ed Gein". biography.com. Retrieved 15 May 2016.
Further reading
- Biographical History of La Crosse, Monroe and Juneau Counties, Wisconsin. Chicago: Lewis Publishing Company, 1892.
- Biographical History of La Crosse, Trempealeau and Buffalo Counties, Wisconsin. Chicago: Lewis Publishing Company, 1892.
- History of La Crosse County, Wisconsin. Chicago: Western Historical Company, 1881.
- Bryant, Benjamin F. (ed.). Memoirs of La Crosse County. Madison, Wis.: Western Historical Association, 1907.
- Wisconsin Jubilee: Proceedings of the Celebration by the County and City of La Crosse on Wisconsin having achieved fifty years of statehood. La Crosse, Wis.: Republican and Leader Print, 1898.
External links
- La Crosse County
- La Crosse County Health and Demographic Data
- La Crosse County map from the Wisconsin Department of Transportation
Places adjacent to La Crosse County, Wisconsin | ||||||||||
|---|---|---|---|---|---|---|---|---|---|---|
| ||||||||||
| Core cities |   | ||||
|---|---|---|---|---|---|
| Surrounding communities |
| ||||
| Counties | |||||
Municipalities and communities of La Crosse County, Wisconsin, United States | ||
|---|---|---|
| Cities | | |
| Villages | ||
| Towns | ||
| CDPs | ||
| Unincorporated communities | ||
| Indian reservation | ||
| Footnotes | ‡This populated place also has portions in an adjacent county or counties | |