List of communities in Saskatchewan
Communities in the Province of Saskatchewan, Canada include incorporated municipalities, unincorporated communities and First Nations communities.


Types of incorporated municipalities include urban municipalities, rural municipalities and northern municipalities. Urban municipalities are further classified into four sub-types – cities, towns, villages and resort villages. Northern municipalities, which are located in the Northern Saskatchewan Administration District (NSAD), are further classified into three sub-types – northern towns, northern villages and northern hamlets. Rural municipalities are not classified into sub-types.[1]
Types of unincorporated communities include hamlets and organized hamlets within rural municipalities and northern settlements within the NSAD.[1]
The administration of rural municipalities, towns, villages, resort villages, organized hamlets, and hamlets is regulated by The Municipalities Act,[2] while the administration of cities is regulated by The Cities Act.[3] Administration of northern towns, northern villages, northern hamlets, and northern settlements (those within the NSAD)[4] is regulated by The Northern Municipalities Act.[5]
In the 2011 Census, Saskatchewan's communities combined for a total provincial population of 1,033,381.[6]
Municipalities
Saskatchewan presently has 786 municipalities of various types (urban, rural and northern municipalities) and sub-types (cities, towns, villages, resort villages, northern towns, northern villages and northern hamlets).[1]
Urban municipalities

Saskatchewan has 466 urban municipalities, which includes the sub-types of cities, towns, villages and resort villages.[1]
Cities
In Saskatchewan, towns must have a population above 5,000 in order to be granted city status.[3] A city does not automatically revert to town status if the population drops below 5,000; this only occurs if the city council requests it, the majority of electors vote to revert to town status, or the appropriate provincial minister is of the opinion that the reversion to town status is in the public interest.[3] The city of Melville retains city status as of 2010 despite dropping below 5,000 population in the 1990s.
Saskatchewan has 16 cities,[1] including Lloydminster and not including Flin Flon.
| Name | Rural municipality[7] | Incorporation date (city) [8] |
Population (2016)[9] |
Population (2011)[10] |
Population (2006)[10] |
Change (%)[10] |
Land area (km²)[10] |
Population density (per km²)[10] |
|---|---|---|---|---|---|---|---|---|
| Estevan | Estevan No. 5 | March 1, 1957 | 11,483 | 11,054 | 10,084 | 9.6 | 18.85 | 586.6 |
| Flin Flon (part)[SK 1] | — | — | 203 | 229[SK 2] | 242 | −5.4 | 2.37[SK 3] | 96.4 |
| Humboldt | Humboldt No. 370 | November 7, 2000 | 5,869 | 5,678 | 4,998 | 13.6 | 13.46 | 421.9 |
| Lloydminster (part)[SK 4] | Britannia No. 502 | January 1, 1958 | 11,765 | 9,772[SK 5] | 8,118 | 20.4 | 17.34[SK 6] | 563.6 |
| Martensville[SK 7] | Corman Park No. 344 | November 3, 2009 | 9,645 | 7,716 | 4,978 | 55.0 | 6.23 | 1,239.3 |
| Meadow Lake | Meadow Lake No. 588 | November 9, 2009 | 5,344 | 5,045 | 4,771 | 5.7 | 7.95 | 634.2 |
| Melfort | Star City No. 428 | September 2, 1980 | 5,992 | 5,576 | 5,192 | 7.4 | 14.78 | 377.3 |
| Melville[SK 8] | Cana No. 214 | August 1, 1960 | 4,562 | 4,546[11] | 4,149 | 9.6 | 14.82 | 306.7 |
| Moose Jaw | Moose Jaw No. 161 | November 20, 1903 | 33,890 | 33,274 | 32,132 | 3.6 | 50.68 | 656.5 |
| North Battleford | North Battleford No. 437 | May 1, 1913 | 14,315 | 13,888 | 13,190 | 5.3 | 33.55 | 414 |
| Prince Albert | Prince Albert No. 461 | October 8, 1904 | 35,926 | 35,129 | 34,127 | 2.9 | 65.74 | 534.4 |
| Regina[SK 9] | Sherwood No. 159 | June 19, 1903 | 215,106 | 193,100 | 179,282 | 7.7 | 145.45 | 1,327.6 |
| Saskatoon[SK 10] | Corman Park No. 344 | May 26, 1906 | 246,376 | 222,189 | 202,408 | 9.8 | 209.56 | 1,060.3 |
| Swift Current | Swift Current No. 137 | January 15, 1914 | 16,604 | 15,503 | 14,946 | 3.7 | 24.04 | 644.9 |
| Warman[SK 11] | Corman Park No. 344 | October 27, 2012 | 11,020 | 7,084 | 4,769 | 48.5 | 8.54 | 829.7 |
| Weyburn | Weyburn No. 67 | September 1, 1913 | 10,870 | 10,484 | 9,433 | 11.1 | 18.49 | 566.9 |
| Yorkton | Orkney No. 244 | February 1, 1928 | 16,343 | 15,669 | 15,038 | 4.2 | 25.77 | 608.1 |
| Total cities | — | — | 629,233 | 595,707 | 547,615 | 8.8 | 675.25 | 882.2 |
Towns
In Saskatchewan, towns are formed from villages or resort villages with a population of at least 500 people.[2] The council of the village or resort village must request the change to town status. When a town's population exceeds 5,000 people, the council may request a change to city status, but the change in incorporation level is not mandatory. Towns with shrinking populations are allowed to retain town status even if the number of residents falls below the 500 limit. For example, the towns of Fleming, Francis, and Scott have populations that have dropped under 500 people and are still qualified under town status. Towns with populations below the limit may, however, revert to village or resort village status if the town council requests it.
Saskatchewan has 146 towns.[1]
| Name | Rural municipality (RM) |
Population (2011)[12] |
Population (2006)[12] |
Change (%)[12] |
Land area (km²)[12] |
Population density (per km²)[12] |
|---|---|---|---|---|---|---|
| Aberdeen | Aberdeen No. 373 | 599 | 527 | 13.7 | 1.95 | 307 |
| Alameda | Moose Creek No. 33 | 342 | 308 | 11 | 2.55 | 133.9 |
| Allan | Blucher No. 343 | 648 | 631 | 2.7 | 1.78 | 363.2 |
| Arborfield | Arborfield No. 456 | 326 | 329 | −0.9 | 0.88 | 370.5 |
| Arcola | Brock No. 64 | 649 | 509 | 27.5 | 3.39 | 191.5 |
| Asquith | Vanscoy No. 345 | 603 | 576 | 4.7 | 1.23 | 491.4 |
| Assiniboia | Lake of the Rivers No. 72 | 2,418 | 2,305 | 4.9 | 3.78 | 639.8 |
| Balcarres | Abernethy No. 186 | 617 | 598 | 3.2 | 1.57 | 392.9 |
| Balgonie | Edenwold No. 158 | 1,625 | 1,384 | 17.4 | 3.15 | 515.8 |
| Battleford | Battle River No. 438 | 4,065 | 3,685 | 10.3 | 23.33 | 174.2 |
| Bengough | Bengough No. 40 | 313 | 337 | −7.1 | 1.07 | 292 |
| Bienfait | Coalfields No. 4 | 780 | 748 | 4.3 | 3.09 | 252.4 |
| Big River | Big River No. 555 | 639 | 728 | −12.2 | 2.51 | 255 |
| Biggar | Biggar No. 347 | 2,161 | 2,033 | 6.3 | 15.75 | 137.2 |
| Birch Hills | Birch Hills No. 460 | 1,064 | 935 | 13.8 | 2.27 | 468.4 |
| Blaine Lake | Blaine Lake No. 434 | 510 | 472 | 8.1 | 1.95 | 261.6 |
| Bredenbury | Saltcoats No. 213 | 364 | 329 | 10.6 | 4.8 | 75.8 |
| Broadview | Elcapo No. 154 | 574 | 611 | −6.1 | 2.45 | 233.8 |
| Bruno | Bayne No. 371 | 574 | 495 | 16 | 0.95 | 606.1 |
| Burstall | Deer Forks No. 232 | 301 | 315 | −4.4 | 1.11 | 270 |
| Cabri | Riverside No. 168 | 399 | 439 | −9.1 | 1.33 | 298.9 |
| Canora | Good Lake No. 274 | 2,219 | 2,013 | 10.2 | 7.31 | 303.7 |
| Carlyle | Moose Mountain No. 63 | 1,441 | 1,257 | 14.6 | 3.19 | 451.1 |
| Carnduff | Mount Pleasant No. 2 | 1,126 | 1,012 | 11.3 | 2.26 | 497.3 |
| Carrot River | Moose Range No. 486 | 1,000 | 941 | 6.3 | 1.42 | 706.4 |
| Central Butte | Enfield No. 194 | 365 | 372 | −1.9 | 2.24 | 163.2 |
| Choiceland | Torch River No. 488 | 381 | 346 | 10.1 | 1.12 | 340.8 |
| Churchbridge | Churchbridge No. 211 | 743 | 704 | 5.5 | 2.76 | 269.2 |
| Colonsay | Colonsay No. 342 | 475 | 425 | 11.8 | 2.46 | 193.1 |
| Coronach | Hart Butte No. 11 | 711 | 770 | −7.7 | 2.33 | 304.9 |
| Craik | Craik No. 222 | 453 | 408 | 11 | 3.02 | 150 |
| Cudworth | Hoodoo No. 401 | 770 | 738 | 4.3 | 2.21 | 348.7 |
| Cupar | Cupar No. 218 | 579 | 566 | 2.3 | 0.8 | 726.7 |
| Cut Knife | Cut Knife No. 439 | 517 | 532 | −2.8 | 1.99 | 259.3 |
| Dalmeny | Corman Park No. 344 | 1,702 | 1,560 | 9.1 | 2.27 | 751 |
| Davidson | Arm River No. 252 | 1,025 | 958 | 7 | 4.49 | 228.4 |
| Delisle | Vanscoy No. 345 | 975 | 898 | 8.6 | 2.49 | 391.3 |
| Duck Lake | Duck Lake No. 463 | 577 | 605 | −4.6 | 2.73 | 211.6 |
| Dundurn | Dundurn No. 314 | 693 | 647 | 7.1 | 1.37 | 505.3 |
| Eastend | White Valley No. 49 | 527 | 471 | 11.9 | 2.71 | 194.7 |
| Eatonia | Chesterfield No. 261 | 508 | 449 | 13.1 | 1.68 | 301.6 |
| Elrose | Monet No. 257 | 477 | 453 | 5.3 | 2.76 | 172.8 |
| Esterhazy | Fertile Belt No. 183 | 2,472 | 2,336 | 5.8 | 4.75 | 520.9 |
| Eston | Snipe Lake No. 259 | 1,031 | 971 | 6.2 | 2.72 | 379.3 |
| Fleming | Moosomin No. 121 | 83 | 75 | 10.7 | 2.17 | 38.3 |
| Foam Lake | Foam Lake No. 276 | 1,148 | 1,123 | 2.2 | 6.06 | 189.4 |
| Fort Qu'Appelle | North Qu'Appelle No. 187 | 2,034 | 1,919 | 6 | 5.28 | 385 |
| Francis | Francis No. 127 | 176 | 148 | 18.9 | 0.59 | 297.4 |
| Govan | Last Mountain Valley No. 250 | 216 | 232 | −6.9 | 1.35 | 159.7 |
| Grand Coulee | Sherwood No. 159 | 571 | 435 | 31.3 | 0.33 | 1,707.5 |
| Gravelbourg | Gravelbourg No. 104 | 1,116 | 1,089 | 2.5 | 3.23 | 346 |
| Grenfell | Elcapo No. 154 | 1,049 | 947 | 10.8 | 3.17 | 331.2 |
| Gull Lake | Gull Lake No. 139 | 989 | 965 | 2.5 | 2.5 | 395.6 |
| Hafford | Redberry No. 435 | 397 | 360 | 10.3 | 0.8 | 496.8 |
| Hague | Rosthern No. 403 | 878 | 707 | 24.2 | 1.08 | 815.5 |
| Hanley | Rosedale No. 283 | 522 | 464 | 12.5 | 2.65 | 196.8 |
| Hepburn | Laird No. 404 | 562 | 530 | 6 | 1.02 | 548.4 |
| Herbert | Morse No. 165 | 759 | 742 | 2.3 | 3.78 | 200.7 |
| Hudson Bay | Hudson Bay No. 394 | 1,900[11] | 1,646 | −8.6 | 17.35 | 86.7 |
| Imperial | Big Arm No. 251 | 349 | 321 | 8.7 | 1.23 | 283.5 |
| Indian Head | Indian Head No. 156 | 1,815 | 1,634 | 11.1 | 3.17 | 572.1 |
| Ituna | Ituna Bon Accord No. 246 | 711 | 622 | 14.3 | 1.56 | 455.5 |
| Kamsack | Cote No. 271 | 1,825 | 1,713 | 6.5 | 5.85 | 311.8 |
| Kelvington | Kelvington No. 366 | 890[11] | 866 | 2.8 | 3.89 | 228.8 |
| Kerrobert | Progress No. 351 | 1,061 | 1,001 | 6 | 7.49 | 141.7 |
| Kindersley | Kindersley No. 290 | 4,678 | 4,412 | 6 | 12.55 | 372.8 |
| Kinistino | Kinistino No. 459 | 743 | 643 | 15.6 | 0.98 | 758.8 |
| Kipling | Kingsley No. 124 | 1,051 | 973 | 8 | 2.15 | 487.9 |
| Kyle | Lacadena No. 228 | 437 | 423 | 3.3 | 1.14 | 383.1 |
| Lafleche | Wood River No. 74 | 406 | 370 | 9.7 | 1.51 | 269.7 |
| Lampman | Browning No. 34 | 713 | 634 | 12.5 | 2.23 | 319.9 |
| Langenburg | Langenburg No. 181 | 1,148 | 1,048 | 9.5 | 3.46 | 332.2 |
| Langham | Corman Park No. 344 | 1,290 | 1,120 | 15.2 | 3.98 | 324.4 |
| Lanigan | Usborne No. 310 | 1,390 | 1,233 | 12.7 | 8.34 | 166.8 |
| Lashburn | Manitou Lake No. 442 | 967 | 914 | 5.8 | 3.11 | 310.5 |
| Leader | Happyland No. 231 | 821 | 881 | −6.8 | 1.71 | 481.2 |
| Lemberg | Abernethy No. 186 | 274 | 255 | 7.5 | 2.67 | 102.7 |
| Leroy | Leroy No. 339 | 427 | 412 | 3.6 | 1.06 | 402.1 |
| Lumsden | Lumsden No. 189 | 1,631 | 1,523 | 7.1 | 4.06 | 402 |
| Luseland | Progress No. 351 | 566 | 571 | −0.9 | 1.53 | 369.6 |
| Macklin | Eye Hill No. 382 | 1,415 | 1,290 | 9.7 | 3.14 | 450.7 |
| Maidstone | Eldon No. 471 | 1,156 | 1,037 | 11.5 | 4.56 | 253.5 |
| Maple Creek | Maple Creek No. 111 | 2,176 | 2,198 | −1 | 4.42 | 492.1 |
| Marshall | Wilton No. 472 | 594[11] | 608 | −2.3 | 1.01 | 588.1 |
| Midale | Cymri No. 36 | 562 | 462 | 21.6 | 1.53 | 368.5 |
| Milestone | Brock No. 64 | 618 | 562 | 10 | 2.17 | 284.4 |
| Moosomin | Moosomin No. 121 | 2,485 | 2,262 | 9.9 | 7.59 | 327.5 |
| Morse | Morse No. 165 | 240 | 236 | 1.7 | 1.45 | 165.7 |
| Mossbank | Lake Johnston No. 102 | 327 | 330 | −0.9 | 1.75 | 186.8 |
| Naicam | Pleasantdale No. 398 | 686 | 690 | −0.6 | 1.69 | 405.5 |
| Nipawin | Nipawin No. 487 | 4,265 | 4,076 | 4.6 | 8.71 | 489.4 |
| Nokomis | Wreford No. 280 | 397 | 404 | −1.7 | 2.61 | 152.3 |
| Norquay | Clayton No. 333 | 435 | 412 | 5.6 | 1.69 | 258 |
| Ogema | Key West No. 70 | 368 | 304 | 21.1 | 1.43 | 257.6 |
| Osler | Corman Park No. 344 | 1,088 | 926 | 17.5 | 1.55 | 700.6 |
| Outlook | Rudy No. 284 | 2,204 | 1,938 | 13.7 | 7.83 | 281.3 |
| Oxbow | Enniskillen No. 3 | 1,285 | 1,139 | 12.8 | 3.13 | 410 |
| Pense | Pense No. 160 | 532 | 507 | 4.9 | 1.32 | 402.6 |
| Pilot Butte | Edenwold No. 158 | 1,848 | 1,872 | −1.3 | 5.05 | 365.6 |
| Ponteix | Grassy Creek No. 78 | 605 | 531 | 13.9 | 1.09 | 556 |
| Porcupine Plain | Porcupine No. 395 | 855 | 783 | 9.2 | 2.27 | 377.2 |
| Preeceville | Preeceville No. 334 | 1,070 | 1,050 | 1.9 | 3.06 | 350.2 |
| Qu'Appelle | South Qu'Appelle No. 157 | 668 | 624 | 7.1 | 4.22 | 158.1 |
| Radisson | Great Bend No. 405 | 505 | 421 | 20 | 2.07 | 243.6 |
| Radville | Laurier No. 38 | 860 | 793 | 8.4 | 2.16 | 398.6 |
| Raymore | Moose Range No. 486 | 568 | 581 | −2.2 | 2.75 | 206.8 |
| Redvers | Antler No. 61 | 975 | 878 | 11 | 2.96 | 329 |
| Regina Beach | Lumsden No. 189 | 1,081 | 1,210 | −10.7 | 3.88 | 278.5 |
| Rocanville | Rocanville No. 151 | 857 | 869 | −1.4 | 2.43 | 352.3 |
| Rockglen | Poplar Valley No. 12 | 400 | 366 | 9.3 | 2.85 | 140.4 |
| Rose Valley | Ponass Lake No. 367 | 296 | 338 | −12.4 | 1.12 | 263.4 |
| Rosetown | St. Andrews No. 287 | 2,317 | 2,277 | 1.8 | 12.14 | 190.8 |
| Rosthern | Rosthern No. 403 | 1,572 | 1,382 | 13.7 | 4.31 | 365 |
| Rouleau | Redburn No. 130 | 453 | 400 | 13.3 | 1.61 | 282.2 |
| Saltcoats | Saltcoats No. 213 | 474 | 467 | 1.5 | 1.35 | 352.2 |
| Scott | Tramping Lake No. 380 | 75 | 91 | −17.6 | 4.39 | 17.1 |
| Shaunavon | Grassy Creek No. 78 | 1,756 | 1,691 | 3.8 | 5.1 | 344.2 |
| Shellbrook | Shellbrook No. 493 | 1,433 | 1,230 | 16.5 | 3.67 | 390.3 |
| Sintaluta | Indian Head No. 156 | 120 | 98 | 22.4 | 2.7 | 44.5 |
| Southey | Cupar No. 218 | 778 | 711 | 9.4 | 1.56 | 499.8 |
| Spiritwood | Spiritwood No. 496 | 916 | 911 | 0.5 | 2.95 | 310 |
| Springside | St. Philips No. 301 | 534 | 513 | 4.1 | 0.68 | 791 |
| St. Brieux | Lake Lenore No. 399 | 590 | 492 | 19.9 | 2.55 | 231.4 |
| St. Walburg | Frenchman Butte No. 501 | 716 | 672 | 6.5 | 2.12 | 338 |
| Star City | Star City No. 428 | 460 | 428 | 7.5 | 0.7 | 661.1 |
| Stoughton | Tecumseh No. 65 | 694 | 653 | 6.3 | 3.41 | 203.2 |
| Strasbourg | McKillop No. 220 | 752 | 732 | 2.7 | 5.7 | 132 |
| Sturgis | Preeceville No. 334 | 620 | 575 | 7.8 | 3.41 | 181.6 |
| Tisdale | Tisdale No. 427 | 3,180 | 3,000 | 6 | 6.47 | 491.5 |
| Turtleford | Mervin No. 499 | 525 | 461 | 13.9 | 1.69 | 311.6 |
| Unity | Round Valley No. 410 | 2,389 | 2,147 | 11.3 | 9.77 | 244.6 |
| Vonda | Grant No. 372 | 353 | 322 | 9.6 | 2.86 | 123.6 |
| Wadena | Lakeview No. 337 | 1,306 | 1,315 | −0.7 | 2.91 | 449.5 |
| Wakaw | Fish Creek No. 402 | 985 | 864 | 14 | 3.12 | 315.9 |
| Waldheim | Laird No. 404 | 1,035 | 868 | 19.2 | 1.97 | 525.5 |
| Wapella | Martin No. 122 | 333 | 311 | 7.1 | 2.57 | 129.8 |
| Watrous | Morris No. 312 | 1,857 | 1,743 | 6.5 | 11.17 | 166.2 |
| Watson | Lakeside No. 338 | 777 | 719 | 8.1 | 2.83 | 274.7 |
| Wawota | Wawken No. 93 | 560 | 522 | 7.3 | 1.24 | 451 |
| White City | Edenwold No. 158 | 1,894 | 1,113 | 70.2 | 6 | 315.6 |
| Whitewood | Willowdale No. 153 | 950 | 869 | 9.3 | 3.04 | 312 |
| Wilkie | Tramping Lake No. 380 | 1,301 | 1,222 | 6.5 | 9.48 | 137.3 |
| Willow Bunch | Willow Bunch No. 42 | 286 | 297 | −3.7 | 0.84 | 339.2 |
| Wolseley | Wolseley No. 155 | 864 | 782 | 10.5 | 5.93 | 145.6 |
| Wynyard | Big Quill No. 308 | 1,767 | 1,744 | 1.3 | 5.29 | 334.1 |
| Yellow Grass | Scott No. 98 | 440 | 371 | 18.6 | 2.68 | 164.1 |
| Zealandia | St. Andrews No. 287 | 80 | 90 | −11.1 | 1.38 | 57.9 |
| Total towns | 137,725 | 127,795 | 7.8 | 473.50 | 290.9 | |
Villages
The people of an organized hamlet may request that the hamlet be incorporated as a village or resort village. In order to qualify, the hamlet must have been an organized hamlet for at least 3 years, have a population of at least 100 in the most recent census, and contain at least 50 separate dwelling units or business premises.[2]
Saskatchewan has 260 villages.[1]
| Name | Incorporation date[13] |
Rural municipality[14] |
Population (2016)[15] |
Population (2011)[15] |
Change (%)[15] |
Land area (km²)[15] |
Population density (per km²)[15] |
|---|---|---|---|---|---|---|---|
| Abbey | September 2, 1913 | Miry Creek No. 229 | 142 | 115 | +23.5% | 0.77 | 184.4/km2 |
| Abernethy | July 26, 1904 | Abernethy No. 186 | 204 | 196 | +4.1% | 1.03 | 198.1/km2 |
| Albertville | January 1, 1986 | Wise Creek No. 77 | 86 | 140 | −38.6% | 1.12 | 76.8/km2 |
| Alida | February 19, 1926 | Reciprocity No. 32 | 120 | 131 | −8.4% | 0.37 | 324.3/km2 |
| Alvena | July 1, 1936 | Fish Creek No. 402 | 60 | 55 | +9.1% | 0.43 | 139.5/km2 |
| Annaheim | April 1, 1977 | St. Peter No. 369 | 210 | 219 | −4.1% | 0.78 | 269.2/km2 |
| Archerwill | January 1, 1947 | Barrier Valley No. 397 | 166 | 200 | −17.0% | 0.83 | 200.0/km2 |
| Arran | September 21, 1916 | Livingston No. 331 | 25 | 40 | −37.5% | 0.69 | 36.2/km2 |
| Atwater | August 12, 1910 | Fertile Belt No. 183 | 30 | 31 | −3.2% | 1.79 | 16.8/km2 |
| Avonlea | February 10, 1912 | Elmsthorpe No. 100 | 393 | 398 | −1.3% | 0.96 | 409.4/km2 |
| Aylesbury | March 31, 1910 | Craik No. 222 | 40 | 42 | −4.8% | 1.28 | 31.3/km2 |
| Aylsham | August 4, 1947 | Nipawin No. 487 | 65 | 71 | −8.5% | 0.48 | 135.4/km2 |
| Bangor | June 8, 1911 | Fertile Belt No. 183 | 38 | 46 | −17.4% | 1.65 | 23.0/km2 |
| Beatty | March 31, 1921 | Flett's Springs No. 429 | 60 | 63 | −4.8% | 0.82 | 73.2/km2 |
| Beechy | May 11, 1925 | Victory No. 226 | 228 | 239 | −4.6% | 1.06 | 215.1/km2 |
| Belle Plaine | August 12, 1910 | Pense No. 160 | 85 | 66 | +28.8% | 1.34 | 63.4/km2 |
| Bethune | August 2, 1912 | Dufferin No. 190 | 399 | 405 | −1.5% | 2.38 | 167.6/km2 |
| Bjorkdale | April 1, 1968 | Bjorkdale No. 426 | 201 | 199 | +1.0% | 1.39 | 144.6/km2 |
| Bladworth | July 27, 1906 | McCraney No. 282 | 65 | 60 | +8.3% | 0.84 | 77.4/km2 |
| Borden | July 19, 1907 | Great Bend No. 405 | 287 | 245 | +17.1% | 0.76 | 377.6/km2 |
| Bracken | January 4, 1926 | Lone Tree No. 18 | 20 | 30 | −33.3% | 0.6 | 33.3/km2 |
| Bradwell | December 26, 1912 | Blucher No. 343 | 166 | 230 | −27.8% | 0.42 | 395.2/km2 |
| Briercrest | April 17, 1912 | Redburn No. 130 | 159 | 111 | +43.2% | 0.62 | 256.5/km2 |
| Brock | July 7, 1910 | Kindersley No. 290 | 142 | 127 | +11.8% | 0.74 | 191.9/km2 |
| Broderick | September 13, 1909 | Rudy No. 284 | 85 | 71 | +19.7% | 0.91 | 93.4/km2 |
| Brownlee | December 29, 1908 | Eyebrow No. 193 | 55 | 50 | +10.0% | 2.42 | 22.7/km2 |
| Buchanan | June 11, 1907 | Buchanan No. 304 | 218 | 225 | −3.1% | 1.29 | 169.0/km2 |
| Buena Vista | November 18, 1983 | Lumsden No. 189 | 612 | 524 | +16.8% | 3.61 | 169.5/km2 |
| Bulyea | March 9, 1909 | McKillop No. 220 | 113 | 102 | +10.8% | 1.28 | 88.3/km2 |
| Cadillac | July 2, 1914 | Wise Creek No. 77 | 92 | 78 | +17.9% | 1.05 | 87.6/km2 |
| Calder | January 18, 1911 | Calder No. 241 | 90 | 97 | −7.2% | 0.75 | 120.0/km2 |
| Canwood | July 18, 1916 | Canwood No. 494 | 332 | 348 | −4.6% | 2.56 | 129.7/km2 |
| Carievale | March 14, 1903 | Argyle No. 1 | 240 | 236 | +1.7% | 0.88 | 272.7/km2 |
| Caronport | January 1, 1988 | Caron No. 162 | 994 | 1,068 | −6.9% | 1.9 | 523.2/km2 |
| Ceylon | September 26, 1911 | The Gap No. 39 | 111 | 99 | +12.1% | 0.75 | 148.0/km2 |
| Chamberlain | January 31, 1911 | Sarnia No. 221 | 90 | 88 | +2.3% | 0.7 | 128.6/km2 |
| Chaplin | October 8, 1912 | Chaplin No. 164 | 229 | 218 | +5.0% | 1.26 | 181.7/km2 |
| Christopher Lake | March 1, 1985 | Lakeland No. 521 | 289 | 281 | +2.8% | 4.56 | 63.4/km2 |
| Clavet | July 1, 1978 | Blucher No. 343 | 410 | 386 | +6.2% | 0.84 | 488.1/km2 |
| Climax | December 11, 1923 | Lone Tree No. 18 | 195 | 182 | +7.1% | 1 | 195.0/km2 |
| Coderre | August 26, 1925 | Rodgers No. 133 | 30 | 30 | 0.0% | 0.85 | 35.3/km2 |
| Codette | March 9, 1929 | Nipawin No. 487 | 198 | 205 | −3.4% | 0.37 | 535.1/km2 |
| Coleville | July 1, 1953 | Oakdale No. 320 | 305 | 311 | −1.9% | 1.87 | 163.1/km2 |
| Conquest | October 24, 1911 | Fertile Valley No. 285 | 160 | 176 | −9.1% | 1 | 160.0/km2 |
| Consul | June 12, 1917 | Reno No. 51 | 73 | 84 | −13.1% | 0.65 | 112.3/km2 |
| Craven | April 11, 1905 | Longlaketon No. 219 | 214 | 234 | −8.5% | 1.21 | 176.9/km2 |
| Creelman | April 6, 1906 | Fillmore No. 96 | 113 | 115 | −1.7% | 1.14 | 99.1/km2 |
| Debden | June 7, 1922 | Canwood No. 494 | 337 | 358 | −5.9% | 1.39 | 242.4/km2 |
| Denholm | June 25, 1912 | Mayfield No. 406 | 88 | 76 | +15.8% | 0.33 | 266.7/km2 |
| Denzil | May 3, 1911 | Eye Hill No. 382 | 143 | 135 | +5.9% | 0.55 | 260.0/km2 |
| Dilke | December 30, 1912 | Sarnia No. 221 | 98 | 77 | +27.3% | 1.28 | 76.6/km2 |
| Dinsmore | November 3, 1913 | Milden No. 286 | 289 | 318 | −9.1% | 2.59 | 111.6/km2 |
| Disley | June 24, 1907 | Lumsden No. 189 | 67 | 75 | −10.7% | 0.65 | 103.1/km2 |
| Dodsland | August 23, 1913 | Winslow No. 319 | 215 | 212 | +1.4% | 2.93 | 73.4/km2 |
| Dorintosh | January 1, 1989 | Meadow Lake No. 588 | 134 | 147 | −8.8% | 0.88 | 152.3/km2 |
| Drake | September 19, 1910 | Usborne No. 310 | 197 | 202 | −2.5% | 0.72 | 273.6/km2 |
| Drinkwater | June 7, 1904 | Redburn No. 130 | 70 | 65 | +7.7% | 2.64 | 26.5/km2 |
| Dubuc | May 29, 1905 | Grayson No. 184 | 61 | 70 | −12.9% | 0.63 | 96.8/km2 |
| Duff | May 28, 1920 | Stanley No. 215 | 30 | 30 | 0.0% | 0.22 | 136.4/km2 |
| Duval | December 21, 1910 | Last Mountain Valley No. 250 | 83 | 97 | −14.4% | 0.75 | 110.7/km2 |
| Dysart | April 6, 1909 | Lipton No. 217 | 200 | 218 | −8.3% | 1.19 | 168.1/km2 |
| Earl Grey | July 27, 1906 | Longlaketon No. 219 | 246 | 239 | +2.9% | 1.31 | 187.8/km2 |
| Ebenezer | July 1, 1948 | Orkney No. 244 | 185 | 175 | +5.7% | 0.62 | 298.4/km2 |
| Edam | October 12, 1911 | Turtle River No. 469 | 480 | 444 | +8.1% | 1.19 | 403.4/km2 |
| Edenwold | October 3, 1912 | Edenwold No. 158 | 233 | 238 | −2.1% | 0.68 | 342.6/km2 |
| Elbow | April 6, 1909 | Loreburn No. 254 | 337 | 314 | +7.3% | 3.92 | 86.0/km2 |
| Elfros | December 1, 1909 | Elfros No. 307 | 90 | 96 | −6.2% | 2.52 | 35.7/km2 |
| Endeavour | April 29, 1953 | Preeceville No. 334 | 65 | 94 | −30.9% | 0.99 | 65.7/km2 |
| Englefeld | June 13, 1916 | St. Peter No. 369 | 285 | 247 | +15.4% | 0.65 | 438.5/km2 |
| Ernfold | December 4, 1912 | Morse No. 165 | 15 | 30 | −50.0% | 1.19 | 12.6/km2 |
| Eyebrow | January 8, 1909 | Eyebrow No. 193 | 119 | 139 | −14.4% | 2.7 | 44.1/km2 |
| Fairlight | October 5, 1909 | Maryfield No. 91 | 40 | 40 | 0.0% | 2.71 | 14.8/km2 |
| Fenwood | June 30, 1909 | Stanley No. 215 | 30 | 40 | −25.0% | 1.74 | 17.2/km2 |
| Fillmore | June 10, 1905 | Fillmore No. 96 | 311 | 255 | +22.0% | 1.33 | 233.8/km2 |
| Findlater | September 27, 1911 | Dufferin No. 190 | 45 | 50 | −10.0% | 1.2 | 37.5/km2 |
| Flaxcombe | June 4, 1913 | Kindersley No. 290 | 124 | 117 | +6.0% | 1.49 | 83.2/km2 |
| Forget | November 21, 1904 | Tecumseh No. 65 | 55 | 35 | +57.1% | 1.39 | 39.6/km2 |
| Fosston | January 1, 1965 | Ponass Lake No. 367 | 45 | 55 | −18.2% | 0.59 | 76.3/km2 |
| Fox Valley | August 30, 1928 | Fox Valley No. 171 | 249 | 260 | −4.2% | 0.6 | 415.0/km2 |
| Frobisher | July 4, 1904 | Coalfields No. 4 | 160 | 166 | −3.6% | 1.35 | 118.5/km2 |
| Frontier | July 10, 1930 | Frontier No. 19 | 372 | 351 | +6.0% | 0.93 | 400.0/km2 |
| Gainsborough | May 25, 1894 | Argyle No. 1 | 254 | 291 | −12.7% | 0.87 | 292.0/km2 |
| Gerald | March 25, 1953 | Spy Hill No. 152 | 136 | 114 | +19.3% | 0.8 | 170.0/km2 |
| Glaslyn | April 16, 1929 | Parkdale No. 498 | 387 | 397 | −2.5% | 1.97 | 196.4/km2 |
| Glen Ewen | March 24, 1904 | Enniskillen No. 3 | 154 | 144 | +6.9% | 2.77 | 55.6/km2 |
| Glenavon | April 13, 1910 | Chester No. 125 | 182 | 176 | +3.4% | 1.32 | 137.9/km2 |
| Glenside | March 30, 1911 | Rudy No. 284 | 76 | 84 | −9.5% | 0.77 | 98.7/km2 |
| Golden Prairie | April 15, 1942 | Big Stick No. 141 | 30 | 35 | −14.3% | 0.41 | 73.2/km2 |
| Goodeve | August 18, 1910 | Stanley No. 215 | 40 | 45 | −11.1% | 2.62 | 15.3/km2 |
| Goodsoil | January 1, 1960 | Beaver River No. 622 | 282 | 281 | +0.4% | 1.98 | 142.4/km2 |
| Goodwater | May 8, 1911 | Lomond No. 37 | 30 | 25 | +20.0% | 0.59 | 50.8/km2 |
| Grayson | April 19, 1906 | Grayson No. 184 | 211 | 184 | +14.7% | 1.87 | 112.8/km2 |
| Halbrite | February 26, 1904 | Cymri No. 36 | 119 | 108 | +10.2% | 1.2 | 99.2/km2 |
| Harris | August 10, 1909 | Harris No. 316 | 193 | 213 | −9.4% | 0.72 | 268.1/km2 |
| Hawarden | July 16, 1909 | Loreburn No. 254 | 52 | 50 | +4.0% | 1.24 | 41.9/km2 |
| Hazenmore | August 20, 1913 | Pinto Creek No. 75 | 70 | 50 | +40.0% | 0.73 | 95.9/km2 |
| Hazlet | January 1, 1963 | Pittville No. 169 | 106 | 95 | +11.6% | 0.55 | 192.7/km2 |
| Heward | November 21, 1904 | Tecumseh No. 65 | 44 | 40 | +10.0% | 0.99 | 44.4/km2 |
| Hodgeville | June 22, 1921 | Lawtonia No. 135 | 172 | 172 | 0.0% | 1.35 | 127.4/km2 |
| Holdfast | October 5, 1911 | Sarnia No. 221 | 247 | 169 | +46.2% | 1.29 | 191.5/km2 |
| Hubbard | June 11, 1910 | Ituna Bon Accord No. 246 | 35 | 46 | −23.9% | 1.25 | 28.0/km2 |
| Hyas | May 23, 1919 | Clayton No. 333 | 70 | 114 | −38.6% | 1.17 | 59.8/km2 |
| Invermay | September 1, 1908 | Invermay No. 305 | 273 | 247 | +10.5% | 1.22 | 223.8/km2 |
| Jansen | October 19, 1908 | Wolverine No. 340 | 96 | 126 | −23.8% | 0.85 | 112.9/km2 |
| Keeler | July 5, 1910 | Marquis No. 191 | 15 | 15 | 0.0% | 1.02 | 14.7/km2 |
| Kelliher | April 27, 1909 | Kellross No. 247 | 217 | 216 | +0.5% | 2.81 | 77.2/km2 |
| Kenaston | July 18, 1910 | McCraney No. 282 | 282 | 285 | −1.1% | 1.17 | 241.0/km2 |
| Kendal | February 17, 1919 | Montmartre No. 126 | 83 | 77 | +7.8% | 0.65 | 127.7/km2 |
| Kennedy | November 5, 1907 | Wawken No. 93 | 216 | 241 | −10.4% | 1.56 | 138.5/km2 |
| Kenosee Lake | October 1, 1987 | Wawken No. 93 | 234 | 258 | −9.3% | 0.35 | 668.6/km2 |
| Killaly | April 28, 1909 | McLeod No. 185 | 65 | 74 | −12.2% | 2.59 | 25.1/km2 |
| Kincaid | July 19, 1913 | Pinto Creek No. 75 | 111 | 114 | −2.6% | 0.82 | 135.4/km2 |
| Kinley | January 7, 1909 | Perdue No. 346 | 60 | 45 | +33.3% | 1.18 | 50.8/km2 |
| Kisbey | May 8, 1907 | Brock No. 64 | 153 | 217 | −29.5% | 2.77 | 55.2/km2 |
| Krydor | August 25, 1914 | Redberry No. 435 | 15 | 15 | 0.0% | 0.82 | 18.3/km2 |
| Laird | May 4, 1911 | Rosthern No. 403 | 267 | 287 | −7.0% | 1.29 | 207.0/km2 |
| Lake Lenore | April 28, 1921 | Lake Lenore No. 399 | 284 | 297 | −4.4% | 0.97 | 292.8/km2 |
| Lancer | September 11, 1913 | Miry Creek No. 229 | 69 | 61 | +13.1% | 1.33 | 51.9/km2 |
| Landis | May 17, 1909 | Reford No. 379 | 152 | 139 | +9.4% | 0.8 | 190.0/km2 |
| Lang | July 27, 1906 | Scott No. 98 | 189 | 200 | −5.5% | 0.64 | 295.3/km2 |
| Leask | September 3, 1912 | Leask No. 464 | 399 | 413 | −3.4% | 0.75 | 532.0/km2 |
| Lebret | October 14, 1912 | North Qu'Appelle No. 187 | 216 | 199 | +8.5% | 1.31 | 164.9/km2 |
| Leoville | June 26, 1944 | Spiritwood No. 496 | 375 | 366 | +2.5% | 1.11 | 337.8/km2 |
| Leross | December 1, 1909 | Kellross No. 247 | 46 | 37 | +24.3% | 1.21 | 38.0/km2 |
| Liberty | January 23, 1912 | Big Arm No. 251 | 78 | 88 | −11.4% | 1.37 | 56.9/km2 |
| Limerick | July 10, 1913 | Stonehenge No. 73 | 115 | 115 | 0.0% | 0.79 | 145.6/km2 |
| Lintlaw | December 14, 1921 | Hazel Dell No. 335 | 172 | 162 | +6.2% | 1.23 | 139.8/km2 |
| Lipton | May 15, 1905 | Lipton No. 217 | 345 | 372 | −7.3% | 0.75 | 460.0/km2 |
| Loon Lake | January 1, 1950 | Loon Lake No. 561 | 288 | 314 | −8.3% | 0.66 | 436.4/km2 |
| Loreburn | May 20, 1909 | Loreburn No. 254 | 107 | 107 | 0.0% | 0.62 | 172.6/km2 |
| Love | June 2, 1945 | Torch River No. 488 | 50 | 65 | −23.1% | 0.46 | 108.7/km2 |
| Lucky Lake | November 23, 1920 | Canaan No. 225 | 289 | 287 | +0.7% | 0.66 | 437.9/km2 |
| MacNutt | February 22, 1913 | Churchbridge No. 211 | 65 | 65 | 0.0% | 0.81 | 80.2/km2 |
| Macoun | October 16, 1903 | Cymri No. 36 | 269 | 246 | +9.3% | 1.68 | 160.1/km2 |
| Macrorie | February 8, 1912 | Fertile Valley No. 285 | 68 | 65 | +4.6% | 0.77 | 88.3/km2 |
| Major | September 29, 1914 | Prairiedale No. 321 | 35 | 61 | −42.6% | 2.78 | 12.6/km2 |
| Makwa | June 1, 1965 | Loon Lake No. 561 | 84 | 97 | −13.4% | 0.66 | 127.3/km2 |
| Mankota | February 3, 1941 | Mankota No. 45 | 205 | 211 | −2.8% | 1.42 | 144.4/km2 |
| Manor | April 15, 1902 | Moose Mountain No. 63 | 295 | 322 | −8.4% | 2.79 | 105.7/km2 |
| Marcelin | September 25, 1911 | Blaine Lake No. 434 | 153 | 158 | −3.2% | 1.32 | 115.9/km2 |
| Marengo | November 5, 1910 | Milton No. 292 | 67 | 47 | +42.6% | 0.87 | 77.0/km2 |
| Margo | April 24, 1911 | Sasman No. 336 | 83 | 100 | −17.0% | 0.8 | 103.8/km2 |
| Markinch | February 16, 1911 | Cupar No. 218 | 58 | 72 | −19.4% | 0.68 | 85.3/km2 |
| Marquis | March 21, 1910 | Marquis No. 191 | 97 | 92 | +5.4% | 0.63 | 154.0/km2 |
| Marsden | April 24, 1931 | Manitou Lake No. 442 | 297 | 284 | +4.6% | 0.94 | 316.0/km2 |
| Maryfield | August 21, 1907 | Maryfield No. 91 | 348 | 365 | −4.7% | 2.69 | 129.4/km2 |
| Maymont | June 24, 1907 | Mayfield No. 406 | 138 | 146 | −5.5% | 0.66 | 209.1/km2 |
| McLean | September 1, 1966 | South Qu'Appelle No. 157 | 405 | 304 | +33.2% | 1.33 | 304.5/km2 |
| McTaggart | October 5, 1909 | Weyburn No. 67 | 121 | 125 | −3.2% | 0.69 | 175.4/km2 |
| Meacham | June 19, 1912 | Colonsay No. 342 | 99 | 84 | +17.9% | 1.27 | 78.0/km2 |
| Meath Park | May 23, 1938 | Garden River No. 490 | 175 | 205 | −14.6% | 0.77 | 227.3/km2 |
| Medstead | April 23, 1931 | Medstead No. 497 | 130 | 120 | +8.3% | 0.67 | 194.0/km2 |
| Mendham | April 1, 1930 | Happyland No. 231 | 30 | 35 | −14.3% | 0.5 | 60.0/km2 |
| Meota | July 6, 1911 | Meota No. 468 | 304 | 307 | −1.0% | 1.55 | 196.1/km2 |
| Mervin | March 17, 1920 | Mervin No. 499 | 159 | 160 | −0.6% | 0.73 | 217.8/km2 |
| Middle Lake | January 1, 1963 | Three Lakes No. 400 | 241 | 242 | −0.4% | 1.26 | 191.3/km2 |
| Milden | July 20, 1911 | Milden No. 286 | 167 | 181 | −7.7% | 1.19 | 140.3/km2 |
| Minton | January 1, 1951 | Surprise Valley No. 9 | 55 | 60 | −8.3% | 0.3 | 183.3/km2 |
| Mistatim | July 1, 1952 | Bjorkdale No. 426 | 101 | 73 | +38.4% | 0.47 | 214.9/km2 |
| Montmartre | October 19, 1908 | Montmartre No. 126 | 490 | 476 | +2.9% | 1.7 | 288.2/km2 |
| Mortlach | January 1, 1949 | Wheatlands No. 163 | 261 | 289 | −9.7% | 2.76 | 94.6/km2 |
| Muenster | August 18, 1908 | St. Peter No. 369 | 430 | 422 | +1.9% | 1.33 | 323.3/km2 |
| Neilburg | January 1, 1947 | Hillsdale No. 440 | 379 | 448 | −15.4% | 1.22 | 310.7/km2 |
| Netherhill | April 28, 1910 | Kindersley No. 290 | 25 | 25 | 0.0% | 0.73 | 34.2/km2 |
| Neudorf | April 25, 1905 | McLeod No. 185 | 263 | 272 | −3.3% | 2.05 | 128.3/km2 |
| Neville | July 5, 1912 | Whiska Creek No. 106 | 87 | 83 | +4.8% | 1.1 | 79.1/km2 |
| North Portal | November 16, 1903 | Coalfields No. 4 | 115 | 143 | −19.6% | 2.49 | 46.2/km2 |
| Odessa | March 14, 1911 | Francis No. 127 | 205 | 239 | −14.2% | 1.18 | 173.7/km2 |
| Osage | May 8, 1906 | Fillmore No. 96 | 20 | 20 | 0.0% | 0.59 | 33.9/km2 |
| Paddockwood | January 1, 1949 | Paddockwood No. 520 | 154 | 163 | −5.5% | 0.65 | 236.9/km2 |
| Pangman | May 17, 1911 | Norton No. 69 | 232 | 214 | +8.4% | 0.73 | 317.8/km2 |
| Paradise Hill | January 1, 1947 | Frenchman Butte No. 501 | 491 | 515 | −4.7% | 2.56 | 191.8/km2 |
| Parkside | February 21, 1913 | Leask No. 464 | 121 | 125 | −3.2% | 0.92 | 131.5/km2 |
| Paynton | May 2, 1907 | Paynton No. 470 | 148 | 151 | −2.0% | 0.85 | 174.1/km2 |
| Pelly | May 4, 1911 | St. Philips No. 301 | 285 | 283 | +0.7% | 0.96 | 296.9/km2 |
| Pennant | July 29, 1912 | Riverside No. 168 | 130 | 120 | +8.3% | 0.65 | 200.0/km2 |
| Perdue | July 15, 1909 | Perdue No. 346 | 334 | 362 | −7.7% | 1.1 | 303.6/km2 |
| Pierceland | January 1, 1973 | Beaver River No. 622 | 598 | 551 | +8.5% | 2.69 | 222.3/km2 |
| Pilger | January 1, 1969 | Three Lakes No. 400 | 65 | 65 | 0.0% | 0.52 | 125.0/km2 |
| Pleasantdale | January 1, 1987 | Pleasantdale No. 398 | 76 | 76 | 0.0% | 0.56 | 135.7/km2 |
| Plenty | March 25, 1911 | Winslow No. 319 | 164 | 131 | +25.2% | 0.65 | 252.3/km2 |
| Plunkett | December 28, 1921 | Viscount No. 341 | 60 | 75 | −20.0% | 0.64 | 93.8/km2 |
| Prelate | October 25, 1913 | Happyland No. 231 | 154 | 124 | +24.2% | 0.87 | 177.0/km2 |
| Prud'homme | November 15, 1922 | Bayne No. 371 | 167 | 172 | −2.9% | 0.84 | 198.8/km2 |
| Punnichy | October 22, 1909 | Mount Hope No. 279 | 213 | 246 | −13.4% | 0.68 | 313.2/km2 |
| Quill Lake | December 8, 1906 | Lakeside No. 338 | 387 | 409 | −5.4% | 1.3 | 297.7/km2 |
| Quinton | March 1, 1910 | Mount Hope No. 279 | 101 | 111 | −9.0% | 0.96 | 105.2/km2 |
| Rama | December 18, 1919 | Invermay No. 305 | 80 | 75 | +6.7% | 0.67 | 119.4/km2 |
| Rhein | March 10, 1913 | Wallace No. 243 | 170 | 158 | +7.6% | 1.09 | 156.0/km2 |
| Richard | October 11, 1916 | Douglas No. 436 | 20 | 30 | −33.3% | 0.73 | 27.4/km2 |
| Richmound | May 5, 1947 | Enterprise No. 142 | 147 | 154 | −4.5% | 0.47 | 312.8/km2 |
| Ridgedale | December 15, 1921 | Connaught No. 457 | 55 | 80 | −31.2% | 0.72 | 76.4/km2 |
| Riverhurst | June 22, 1916 | Maple Bush No. 224 | 130 | 114 | +14.0% | 0.91 | 142.9/km2 |
| Roche Percée | January 12, 1909 | Coalfields No. 4 | 110 | 153 | −28.1% | 2.83 | 38.9/km2 |
| Ruddell | March 18, 1914 | Mayfield No. 406 | 20 | 20 | 0.0% | 0.47 | 42.6/km2 |
| Rush Lake | October 16, 1911 | Excelsior No. 166 | 53 | 65 | −18.5% | 0.74 | 71.6/km2 |
| Sceptre | April 30, 1913 | Clinworth No. 230 | 94 | 97 | −3.1% | 1.23 | 76.4/km2 |
| Sedley | August 3, 1907 | Francis No. 127 | 358 | 337 | +6.2% | 1.33 | 269.2/km2 |
| Semans | December 14, 1908 | Mount Hope No. 279 | 196 | 204 | −3.9% | 1.14 | 171.9/km2 |
| Senlac | October 11, 1916 | Senlac No. 411 | 41 | 46 | −10.9% | 0.6 | 68.3/km2 |
| Shamrock | January 1, 1960 | Shamrock No. 134 | 20 | 20 | 0.0% | 0.79 | 25.3/km2 |
| Sheho | June 30, 1905 | Viscount No. 341 | 105 | 130 | −19.2% | 1.95 | 53.8/km2 |
| Shell Lake | October 18, 1940 | Spiritwood No. 496 | 175 | 152 | +15.1% | 1.23 | 142.3/km2 |
| Silton | July 2, 1914 | McKillop No. 220 | 71 | 95 | −25.3% | 1.07 | 66.4/km2 |
| Simpson | July 11, 1911 | Wood Creek No. 281 | 127 | 131 | −3.1% | 1.41 | 90.1/km2 |
| Smeaton | March 7, 1944 | Torch River No. 488 | 182 | 181 | +0.6% | 1.48 | 123.0/km2 |
| Smiley | November 26, 1913 | Prairiedale No. 321 | 60 | 60 | 0.0% | 0.64 | 93.8/km2 |
| Spalding | March 11, 1924 | Spalding No. 368 | 244 | 242 | +0.8% | 1.18 | 206.8/km2 |
| Speers | December 24, 1915 | Douglas No. 436 | 60 | 65 | −7.7% | 0.69 | 87.0/km2 |
| Spy Hill | April 22, 1910 | Spy Hill No. 152 | 168 | 204 | −17.6% | 1.19 | 141.2/km2 |
| St. Benedict | January 1, 1964 | Three Lakes No. 400 | 84 | 82 | +2.4% | 0.54 | 155.6/km2 |
| St. Gregor | March 26, 1920 | St. Peter No. 369 | 97 | 98 | −1.0% | 0.91 | 106.6/km2 |
| St. Louis | May 19, 1959 | St. Louis No. 431 | 415 | 449 | −7.6% | 1.08 | 384.3/km2 |
| Stenen | August 14, 1912 | Clayton No. 333 | 90 | 79 | +13.9% | 0.7 | 128.6/km2 |
| Stewart Valley | January 1, 1958 | Saskatchewan Landing No. 167 | 91 | 76 | +19.7% | 0.86 | 105.8/km2 |
| Stockholm | June 30, 1905 | Fertile Belt No. 183 | 352 | 341 | +3.2% | 1.65 | 213.3/km2 |
| Storthoaks | June 5, 1940 | Storthoaks No. 31 | 108 | 93 | +16.1% | 0.49 | 220.4/km2 |
| Strongfield | May 3, 1912 | Loreburn No. 254 | 40 | 40 | 0.0% | 0.8 | 50.0/km2 |
| Success | October 25, 1912 | Riverside No. 168 | 45 | 40 | +12.5% | 1.38 | 32.6/km2 |
| Tantallon | June 17, 1904 | Spy Hill No. 152 | 91 | 105 | −13.3% | 0.84 | 108.3/km2 |
| Tessier | August 24, 1909 | Harris No. 316 | 25 | 25 | 0.0% | 1 | 25.0/km2 |
| Theodore | July 5, 1907 | Insinger No. 275 | 323 | 345 | −6.4% | 1.73 | 186.7/km2 |
| Togo | September 4, 1906 | Cote No. 271 | 86 | 87 | −1.1% | 1.5 | 57.3/km2 |
| Tompkins | June 2, 1910 | Gull Lake No. 139 | 152 | 170 | −10.6% | 2.65 | 57.4/km2 |
| Torquay | December 11, 1923 | Cambria No. 6 | 255 | 236 | +8.1% | 1.35 | 188.9/km2 |
| Tramping Lake | April 10, 1917 | Tramping Lake No. 380 | 60 | 55 | +9.1% | 1.39 | 43.2/km2 |
| Tugaske | May 7, 1909 | Huron No. 223 | 75 | 92 | −18.5% | 0.76 | 98.7/km2 |
| Tuxford | July 19, 1907 | Marquis No. 191 | 113 | 91 | +24.2% | 0.62 | 182.3/km2 |
| Val Marie | September 13, 1926 | Val Marie No. 17 | 126 | 130 | −3.1% | 0.42 | 300.0/km2 |
| Valparaiso | July 18, 1924 | Star City No. 428 | 15 | 15 | 0.0% | 0.69 | 21.7/km2 |
| Vanguard | July 8, 1912 | Whiska Creek No. 106 | 134 | 152 | −11.8% | 1.86 | 72.0/km2 |
| Vanscoy | June 17, 1919 | Vanscoy No. 345 | 462 | 377 | +22.5% | 1.49 | 310.1/km2 |
| Vibank | June 23, 1911 | Francis No. 127 | 385 | 374 | +2.9% | 0.73 | 527.4/km2 |
| Viscount | December 17, 1908 | Viscount No. 341 | 232 | 252 | −7.9% | 1.18 | 196.6/km2 |
| Waldeck | December 23, 1913 | Excelsior No. 166 | 277 | 297 | −6.7% | 2 | 138.5/km2 |
| Waldron | July 17, 1909 | Grayson No. 184 | 15 | 20 | −25.0% | 1.45 | 10.3/km2 |
| Waseca | March 15, 1911 | Eldon No. 471 | 149 | 154 | −3.2% | 0.68 | 219.1/km2 |
| Webb | June 18, 1910 | Webb No. 138 | 50 | 58 | −13.8% | 1.41 | 35.5/km2 |
| Weekes | January 13, 1947 | Porcupine No. 395 | 40 | 42 | −4.8% | 0.59 | 67.8/km2 |
| Weirdale | April 1, 1948 | Garden River No. 490 | 50 | 75 | −33.3% | 1.36 | 36.8/km2 |
| Weldon | January 24, 1914 | Kinistino No. 459 | 197 | 196 | +0.5% | 1.1 | 179.1/km2 |
| White Fox | July 21, 1941 | Torch River No. 488 | 355 | 364 | −2.5% | 0.85 | 417.6/km2 |
| Wilcox | April 20, 1907 | Bratt's Lake No. 129 | 264 | 339 | −22.1% | 1.48 | 178.4/km2 |
| Windthorst | August 21, 1907 | Chester No. 125 | 211 | 215 | −1.9% | 1.43 | 147.6/km2 |
| Wiseton | September 23, 1913 | Milden No. 286 | 79 | 88 | −10.2% | 0.77 | 102.6/km2 |
| Wood Mountain | March 4, 1930 | Old Post No. 43 | 20 | 25 | −20.0% | 0.61 | 32.8/km2 |
| Yarbo | July 1, 1964 | Langenburg No. 181 | 57 | 53 | +7.5% | 0.83 | 68.7/km2 |
| Young | June 7, 1910 | Morris No. 312 | 244 | 239 | +2.1% | 2.51 | 97.2/km2 |
| Zelma | August 10, 1910 | Morris No. 312 | 35 | 35 | 0.0% | 0.72 | 48.6/km2 |
| Zenon Park | July 28, 1941 | Arborfield No. 456 | 194 | 187 | +3.7% | 0.56 | 346.4/km2 |
| Total villages | 41,514 | 41,945 | −1.0% | 295.11 | 140.67/km2 | ||
Resort villages
Saskatchewan has 40 resort villages.[1]
| Name | Rural municipality (RM)[16] |
Population (2011)[17] |
Population (2006)[17] |
Change (%)[17] |
Land area (km²)[17] |
Population density (per km²)[17] |
|---|---|---|---|---|---|---|
| Alice Beach | Sarnia No. 221 | 45 | 68 | −33.8 | 0.71 | 63.7 |
| Aquadeo | Meota No. 468 | 84 | 123 | −31.7 | 0.74 | 113.3 |
| Beaver Flat | Excelsior No. 166 | 40 | 58 | −31 | 0.92 | 43.6 |
| Big Shell | Spiritwood No. 496 | 45 | 45 | 0 | 1.02 | 44.3 |
| Bird's Point | Fertile Belt No. 183 | 103 | 88 | 17 | 0.58 | 177.4 |
| B-Say-Tah | North Qu'Appelle No. 187 | 187 | 206 | −9.2 | 1.33 | 140.3 |
| Candle Lake | Paddockwood No. 520 | 765 | 792 | −3.4 | 63.32 | 12.1 |
| Chitek Lake | Big River No. 555 | 167 | 219 | −23.7 | 2.54 | 65.9 |
| Chorney Beach | Foam Lake No. 276 | 15 | 36 | −58.3 | 0.17 | 89.4 |
| Cochin | Meota No. 468 | 122 | 208 | −41.3 | 1.35 | 90.6 |
| Coteau Beach | Coteau No. 255 | 40 | 30 | 33.3 | 0.54 | 74.2 |
| Echo Bay | Spiritwood No. 496 | 38 | 77 | −50.6 | 0.8 | 47.7 |
| Etters Beach | Big Arm No. 251 | 30 | 15 | 100 | 0.12 | 253.4 |
| Fort San | North Qu'Appelle No. 187 | 187 | 215 | −13 | 2.9 | 64.6 |
| Glen Harbour | McKillop No. 220 | 65 | 73 | −11 | 0.35 | 185.8 |
| Grandview Beach | Sarnia No. 221 | 25 | 35 | −28.6 | 0.25 | 98.6 |
| Greig Lake | Meadow Lake No. 588 | 23 | 20 | 15 | 0.14 | 163.2 |
| Island View | McKillop No. 220 | 65 | 88 | −26.1 | 0.43 | 150.2 |
| Kannata Valley | Longlaketon No. 219 | 101 | 133 | −24.1 | 0.63 | 159.6 |
| Katepwa | Abernethy No. 186 | 403 | 285 | 41.4 | 5.78 | 69.7 |
| Kivimaa-Moonlight Bay | Mervin No. 499 | 84 | 126 | −33.3 | 0.55 | 154 |
| Leslie Beach | Foam Lake No. 276 | 23 | 30 | −23.3 | 0.56 | 41.1 |
| Lumsden Beach | Lumsden No. 189 | 10[18] | 40 | −75.0 | 0.47 | 21.3 |
| Manitou Beach | Morris No. 312 | 257 | 233 | 10.3 | 3.09 | 83.1 |
| Melville Beach | Grayson No. 184 | 27[18] | 41 | −34.1 | 0.21 | 128.6 |
| Metinota | Meota No. 468 | 89 | 89 | 0 | 0.52 | 170 |
| Mistusinne | Maple Bush No. 224 | 66 | 56 | 17.9 | 1.49 | 44.3 |
| North Grove | Dufferin No. 190 | 49[18] | 68 | −27.9 | 1.03 | 47.8 |
| Pebble Baye | Leask No. 464 | 33 | 27 | 22.2 | 0.74 | 44.4 |
| Pelican Pointe | McKillop No. 220 | 15 | 23 | −34.8 | 0.12 | 125.2 |
| Saskatchewan Beach | McKillop No. 220 | 213 | 155 | 37.4 | 1.57 | 135.5 |
| Shields | Dundurn No. 314 | 220 | 172 | 27.9 | 0.72 | 304.5 |
| South Lake | Marquis No. 191 | 48 | 105 | −54.3 | 1.15 | 41.9 |
| Sun Valley | Marquis No. 191 | 80[18] | 128 | −37.5 | 2.33 | 34.3 |
| Sunset Cove | McKillop No. 220 | 25 | 26 | −3.8 | 0.17 | 148.4 |
| Thode | Dundurn No. 314 | 157 | 156 | 0.6 | 0.73 | 214.2 |
| Tobin Lake | Moose Range No. 486 | 90 | 87 | 3.4 | 1.81 | 49.6 |
| Wakaw Lake | Hoodoo No. 401 | 30 | 35 | −14.3 | 0.59 | 50.9 |
| Wee Too Beach | Sarnia No. 221 | 35 | 60 | −41.7 | 0.17 | 207.8 |
| West End | Fertile Belt No. 183 | 17 | 26 | −34.6 | 0.34 | 50.4 |
| Total resort villages | 4,118 | 4,497 | −8.4 | 102.98 | 40.0 | |
Rural municipalities

A rural municipality is created by the Minister of Municipal Affairs by ministerial order via section 49 of The Municipalities Act.[19] Saskatchewan has 296 rural municipalities,[1] which are located in the central and southern portions of the province.[20]
Saskatchewan has 296 rural municipalities.[1]
| Rural municipality (RM)[21] |
Incorporation date[22] |
Population (2016)[15] |
Population (2011)[15] |
Change (%)[15] |
Land area (km²)[15] |
Population density (per km²)[15] |
|---|---|---|---|---|---|---|
| Aberdeen No. 373 | December 13, 1909 | 1,379 | 1,016 | +35.7% | 673.42 | 2.0/km2 |
| Abernethy No. 186 | December 11, 1911 | 362 | 387 | −6.5% | 779.42 | 0.5/km2 |
| Antelope Park No. 322 | December 11, 1911 | 130 | 150 | −13.3% | 612.9 | 0.2/km2 |
| Antler No. 61 | December 13, 1909 | 523 | 577 | −9.4% | 832.81 | 0.6/km2 |
| Arborfield No. 456 | January 1, 1913 | 343 | 453 | −24.3% | 1,416.01 | 0.2/km2 |
| Argyle No. 1 | December 19, 1912 | 290 | 270 | +7.4% | 579.88 | 0.5/km2 |
| Arlington No. 79 | January 1, 1913 | 366 | 345 | +6.1% | 846.79 | 0.4/km2 |
| Arm River No. 252 | December 13, 1909 | 250 | 249 | +0.4% | 725.3 | 0.3/km2 |
| Auvergne No. 76 | January 1, 1913 | 412 | 354 | +16.4% | 854.46 | 0.5/km2 |
| Baildon No. 131 | December 9, 1912 | 620 | 594 | +4.4% | 846.21 | 0.7/km2 |
| Barrier Valley No. 397 | October 29, 1917 | 431 | 498 | −13.5% | 819.99 | 0.5/km2 |
| Battle River No. 438 | December 12, 1910 | 1,154 | 1,099 | +5.0% | 1,061.4 | 1.1/km2 |
| Bayne No. 371 | December 12, 1910 | 467 | 493 | −5.3% | 802.93 | 0.6/km2 |
| Beaver River No. 622 | January 1, 1978 | 1,216 | 1,017 | +19.6% | 2,370.09 | 0.5/km2 |
| Bengough No. 40 | January 1, 1913 | 281 | 329 | −14.6% | 1,036.91 | 0.3/km2 |
| Benson No. 35 | December 13, 1909 | 472 | 490 | −3.7% | 836.39 | 0.6/km2 |
| Big Arm No. 251 | December 11, 1911 | 191 | 200 | −4.5% | 699.32 | 0.3/km2 |
| Big Quill No. 308 | December 13, 1909 | 519 | 587 | −11.6% | 739.86 | 0.7/km2 |
| Big River No. 555 | October 1, 1977 | 889 | 855 | +4.0% | 2,487.82 | 0.4/km2 |
| Big Stick No. 141 | December 11, 1911 | 136 | 148 | −8.1% | 821.4 | 0.2/km2 |
| Biggar No. 347 | December 11, 1911 | 798 | 820 | −2.7% | 1,598.56 | 0.5/km2 |
| Birch Hills No. 460 | December 11, 1911 | 656 | 663 | −1.1% | 554.07 | 1.2/km2 |
| Bjorkdale No. 426 | January 1, 1913 | 851 | 900 | −5.4% | 1,460.5 | 0.6/km2 |
| Blaine Lake No. 434 | December 9, 1912 | 291 | 288 | +1.0% | 799.69 | 0.4/km2 |
| Blucher No. 343 | December 13, 1909 | 2,006 | 1,876 | +6.9% | 789.64 | 2.5/km2 |
| Bone Creek No. 108 | December 11, 1911 | 394 | 340 | +15.9% | 847.16 | 0.5/km2 |
| Bratt's Lake No. 129 | January 1, 1913 | 315 | 350 | −10.0% | 844.94 | 0.4/km2 |
| Britannia No. 502 | December 13, 1909 | 2,153 | 1,734 | +24.2% | 950.39 | 2.3/km2 |
| Brock No. 64 | December 12, 1910 | 267 | 238 | +12.2% | 797.13 | 0.3/km2 |
| Brokenshell No. 68 | December 13, 1909 | 312 | 308 | +1.3% | 850.01 | 0.4/km2 |
| Browning No. 34 | December 11, 1911 | 375 | 399 | −6.0% | 823.38 | 0.5/km2 |
| Buchanan No. 304 | January 1, 1913 | 301 | 406 | −25.9% | 738.8 | 0.4/km2 |
| Buckland No. 491 | December 11, 1911 | 3,375 | 3,658 | −7.7% | 791.69 | 4.3/km2 |
| Buffalo No. 409 | December 13, 1909 | 506 | 506 | 0.0% | 1,222.08 | 0.4/km2 |
| Calder No. 241 | January 1, 1913 | 370 | 322 | +14.9% | 807.27 | 0.5/km2 |
| Caledonia No. 99 | December 13, 1909 | 245 | 257 | −4.7% | 845.68 | 0.3/km2 |
| Cambria No. 6 | December 13, 1909 | 309 | 304 | +1.6% | 814.14 | 0.4/km2 |
| Cana No. 214 | December 13, 1909 | 867 | 858 | +1.0% | 820.9 | 1.1/km2 |
| Canaan No. 225 | January 1, 1913 | 140 | 149 | −6.0% | 549.09 | 0.3/km2 |
| Canwood No. 494 | January 1, 1913 | 1,381 | 1,424 | −3.0% | 1,945.2 | 0.7/km2 |
| Carmichael No. 109 | December 9, 1912 | 444 | 440 | +0.9% | 846.4 | 0.5/km2 |
| Caron No. 162 | December 9, 1912 | 576 | 516 | +11.6% | 569.87 | 1.0/km2 |
| Chaplin No. 164 | January 1, 1913 | 113 | 147 | −23.1% | 802.74 | 0.1/km2 |
| Chester No. 125 | December 13, 1909 | 383 | 373 | +2.7% | 837.08 | 0.5/km2 |
| Chesterfield No. 261 | December 9, 1912 | 481 | 480 | +0.2% | 1,943.29 | 0.2/km2 |
| Churchbridge No. 211 | January 1, 1913 | 619 | 673 | −8.0% | 958.57 | 0.6/km2 |
| Clayton No. 333 | January 1, 1913 | 592 | 669 | −11.5% | 1,401.57 | 0.4/km2 |
| Clinworth No. 230 | December 9, 1912 | 154 | 211 | −27.0% | 1,432.75 | 0.1/km2 |
| Coalfields No. 4 | January 1, 1913 | 368 | 382 | −3.7% | 819.52 | 0.4/km2 |
| Colonsay No. 342 | December 13, 1909 | 269 | 240 | +12.1% | 549.99 | 0.5/km2 |
| Connaught No. 457 | December 11, 1911 | 586 | 629 | −6.8% | 853.11 | 0.7/km2 |
| Corman Park No. 344 | January 1, 1970 | 8,568 | 8,277 | +3.5% | 1,911.35 | 4.5/km2 |
| Cote No. 271 | December 12, 1910 | 548 | 580 | −5.5% | 879.8 | 0.6/km2 |
| Coteau No. 255 | December 12, 1910 | 475 | 420 | +13.1% | 899.27 | 0.5/km2 |
| Coulee No. 136 | December 12, 1910 | 563 | 582 | −3.3% | 843.69 | 0.7/km2 |
| Craik No. 222 | December 9, 1912 | 259 | 276 | −6.2% | 885.41 | 0.3/km2 |
| Cupar No. 218 | December 13, 1909 | 503 | 554 | −9.2% | 912.96 | 0.6/km2 |
| Cut Knife No. 439 | December 13, 1909 | 364 | 359 | +1.4% | 653 | 0.6/km2 |
| Cymri No. 36 | December 13, 1909 | 549 | 524 | +4.8% | 832.32 | 0.7/km2 |
| Deer Forks No. 232 | January 1, 1913 | 109 | 223 | −51.1% | 736.26 | 0.1/km2 |
| Douglas No. 436 | December 13, 1909 | 350 | 331 | +5.7% | 820.37 | 0.4/km2 |
| Duck Lake No. 463 | January 1, 1913 | 1,004 | 846 | +18.7% | 1,046.93 | 1.0/km2 |
| Dufferin No. 190 | December 9, 1912 | 559 | 491 | +13.8% | 957.04 | 0.6/km2 |
| Dundurn No. 314 | December 13, 1909 | 2,404 | 1,148 | +109.4% | 807.94 | 3.0/km2 |
| Eagle Creek No. 376 | December 13, 1909 | 595 | 580 | +2.6% | 833.08 | 0.7/km2 |
| Edenwold No. 158 | December 9, 1912 | 4,490 | 4,132 | +8.7% | 849.04 | 5.3/km2 |
| Elcapo No. 154 | December 12, 1910 | 488 | 481 | +1.5% | 846.04 | 0.6/km2 |
| Eldon No. 471 | December 13, 1909 | 750 | 751 | −0.1% | 1,007.59 | 0.7/km2 |
| Elfros No. 307 | December 13, 1909 | 391 | 432 | −9.5% | 697.34 | 0.6/km2 |
| Elmsthorpe No. 100 | December 12, 1910 | 226 | 210 | +7.6% | 843.12 | 0.3/km2 |
| Emerald No. 277 | December 12, 1910 | 405 | 447 | −9.4% | 854.44 | 0.5/km2 |
| Enfield No. 194 | December 13, 1909 | 226 | 270 | −16.3% | 1,014.1 | 0.2/km2 |
| Enniskillen No. 3 | December 13, 1909 | 459 | 452 | +1.5% | 834.67 | 0.5/km2 |
| Enterprise No. 142 | April 18, 1913 | 110 | 140 | −21.4% | 989.73 | 0.1/km2 |
| Estevan No. 5 | December 12, 1910 | 1,370 | 1,139 | +20.3% | 773.38 | 1.8/km2 |
| Excel No. 71 | January 1, 1913 | 391 | 427 | −8.4% | 1,122.02 | 0.3/km2 |
| Excelsior No. 166 | December 13, 1909 | 806 | 959 | −16.0% | 1,198.35 | 0.7/km2 |
| Eye Hill No. 382 | December 12, 1910 | 590 | 614 | −3.9% | 798.3 | 0.7/km2 |
| Eyebrow No. 193 | December 13, 1909 | 195 | 230 | −15.2% | 835.04 | 0.2/km2 |
| Fertile Belt No. 183 | January 1, 1913 | 781 | 785 | −0.5% | 1,006.67 | 0.8/km2 |
| Fertile Valley No. 285 | December 13, 1909 | 539 | 511 | +5.5% | 1,016.37 | 0.5/km2 |
| Fillmore No. 96 | December 13, 1909 | 223 | 255 | −12.5% | 828.33 | 0.3/km2 |
| Fish Creek No. 402 | January 1, 1913 | 345 | 304 | +13.5% | 597.9 | 0.6/km2 |
| Flett's Springs No. 429 | December 13, 1909 | 732 | 751 | −2.5% | 844.61 | 0.9/km2 |
| Foam Lake No. 276 | December 12, 1910 | 586 | 587 | −0.2% | 1,345.98 | 0.4/km2 |
| Fox Valley No. 171 | October 29, 1913 | 330 | 345 | −4.3% | 1,253.79 | 0.3/km2 |
| Francis No. 127 | December 13, 1909 | 674 | 676 | −0.3% | 1,106.79 | 0.6/km2 |
| Frenchman Butte No. 501 | January 1, 1954 | 1,494 | 1,438 | +3.9% | 1,927.39 | 0.8/km2 |
| Frontier No. 19 | January 1, 1913 | 326 | 371 | −12.1% | 1,675.02 | 0.2/km2 |
| Garden River No. 490 | January 1, 1913 | 727 | 641 | +13.4% | 662.9 | 1.1/km2 |
| Garry No. 245 | January 1, 1913 | 364 | 412 | −11.7% | 853.59 | 0.4/km2 |
| Glen Bain No. 105 | December 11, 1911 | 180 | 205 | −12.2% | 843.4 | 0.2/km2 |
| Glen McPherson No. 46 | January 1, 1913 | 72 | 73 | −1.4% | 848.29 | 0.1/km2 |
| Glenside No. 377 | December 13, 1909 | 248 | 267 | −7.1% | 905.74 | 0.3/km2 |
| Golden West No. 95 | December 13, 1909 | 291 | 315 | −7.6% | 790.72 | 0.4/km2 |
| Good Lake No. 274 | January 1, 1913 | 747 | 684 | +9.2% | 809.94 | 0.9/km2 |
| Grandview No. 349 | December 11, 1911 | 348 | 350 | −0.6% | 715.38 | 0.5/km2 |
| Grant No. 372 | December 13, 1909 | 466 | 425 | +9.6% | 666.16 | 0.7/km2 |
| Grass Lake No. 381 | December 13, 1909 | 399 | 369 | +8.1% | 801.29 | 0.5/km2 |
| Grassy Creek No. 78 | January 1, 1913 | 364 | 284 | +28.2% | 837.4 | 0.4/km2 |
| Gravelbourg No. 104 | December 9, 1912 | 472 | 306 | +54.2% | 841.98 | 0.6/km2 |
| Grayson No. 184 | January 1, 1913 | 512 | 478 | +7.1% | 874.77 | 0.6/km2 |
| Great Bend No. 405 | December 12, 1910 | 509 | 499 | +2.0% | 830.58 | 0.6/km2 |
| Griffin No. 66 | December 13, 1909 | 438 | 398 | +10.1% | 816.59 | 0.5/km2 |
| Gull Lake No. 139 | January 1, 1913 | 201 | 201 | 0.0% | 836.41 | 0.2/km2 |
| Happy Valley No. 10 | January 1, 1913 | 139 | 148 | −6.1% | 812.74 | 0.2/km2 |
| Happyland No. 231 | January 1, 1913 | 249 | 284 | −12.3% | 1,259 | 0.2/km2 |
| Harris No. 316 | December 12, 1910 | 193 | 224 | −13.8% | 805.42 | 0.2/km2 |
| Hart Butte No. 11 | January 1, 1913 | 252 | 264 | −4.5% | 841.98 | 0.3/km2 |
| Hazel Dell No. 335 | January 1, 1913 | 515 | 511 | +0.8% | 1,394.02 | 0.4/km2 |
| Hazelwood No. 94 | January 1, 1913 | 230 | 246 | −6.5% | 743.81 | 0.3/km2 |
| Heart's Hill No. 352 | November 15, 1910 | 244 | 260 | −6.2% | 838.37 | 0.3/km2 |
| Hillsborough No. 132 | January 1, 1913 | 101 | 114 | −11.4% | 445.25 | 0.2/km2 |
| Hillsdale No. 440 | January 1, 1913 | 553 | 563 | −1.8% | 1,028.72 | 0.5/km2 |
| Hoodoo No. 401 | January 1, 1913 | 675 | 706 | −4.4% | 810.58 | 0.8/km2 |
| Hudson Bay No. 394 | May 1, 1977 | 1,114 | 1,122 | −0.7% | 12,462.61 | 0.1/km2 |
| Humboldt No. 370 | January 1, 1913 | 935 | 885 | +5.6% | 796.69 | 1.2/km2 |
| Huron No. 223 | December 12, 1910 | 198 | 196 | +1.0% | 842.11 | 0.2/km2 |
| Indian Head No. 156 | August 6, 1884 | 336 | 380 | −11.6% | 759.98 | 0.4/km2 |
| Insinger No. 275 | January 1, 1913 | 315 | 325 | −3.1% | 849.38 | 0.4/km2 |
| Invergordon No. 430 | December 11, 1911 | 565 | 651 | −13.2% | 854.19 | 0.7/km2 |
| Invermay No. 305 | December 11, 1911 | 325 | 334 | −2.7% | 729.44 | 0.4/km2 |
| Ituna Bon Accord No. 246 | January 1, 1913 | 374 | 435 | −14.0% | 837.23 | 0.4/km2 |
| Kellross No. 247 | December 13, 1909 | 305 | 362 | −15.7% | 834.09 | 0.4/km2 |
| Kelvington No. 366 | January 1, 1913 | 398 | 494 | −19.4% | 862.24 | 0.5/km2 |
| Key West No. 70 | December 12, 1910 | 255 | 287 | −11.1% | 825.26 | 0.3/km2 |
| Keys No. 303 | January 1, 1913 | 390 | 417 | −6.5% | 661.61 | 0.6/km2 |
| Kindersley No. 290 | December 12, 1910 | 1,049 | 987 | +6.3% | 2,112.68 | 0.5/km2 |
| King George No. 256 | December 11, 1911 | 226 | 217 | +4.1% | 831.97 | 0.3/km2 |
| Kingsley No. 124 | December 12, 1910 | 444 | 421 | +5.5% | 844.06 | 0.5/km2 |
| Kinistino No. 459 | December 11, 1911 | 554 | 613 | −9.6% | 948.46 | 0.6/km2 |
| Lac Pelletier No. 107 | January 1, 1913 | 546 | 607 | −10.0% | 849.27 | 0.6/km2 |
| Lacadena No. 228 | December 12, 1910 | 535 | 572 | −6.5% | 1,895.97 | 0.3/km2 |
| Laird No. 404 | December 12, 1910 | 1,387 | 1,240 | +11.9% | 729.98 | 1.9/km2 |
| Lajord No. 128 | December 13, 1909 | 1,232 | 993 | +24.1% | 943.87 | 1.3/km2 |
| Lake Alma No. 8 | May 5, 1913 | 242 | 250 | −3.2% | 822.47 | 0.3/km2 |
| Lake Johnston No. 102 | December 9, 1912 | 170 | 160 | +6.3% | 567.24 | 0.3/km2 |
| Lake Lenore No. 399 | January 1, 1913 | 587 | 536 | +9.5% | 723.53 | 0.8/km2 |
| Lake of the Rivers No. 72 | December 11, 1911 | 279 | 302 | −7.6% | 677.5 | 0.4/km2 |
| Lakeland No. 521 | August 1, 1977 | 915 | 869 | +5.3% | 493.44 | 1.9/km2 |
| Lakeside No. 338 | December 12, 1910 | 415 | 387 | +7.2% | 636.8 | 0.7/km2 |
| Lakeview No. 337 | December 13, 1909 | 368 | 336 | +9.5% | 724.89 | 0.5/km2 |
| Langenburg No. 181 | January 1, 1913 | 557 | 572 | −2.6% | 675.42 | 0.8/km2 |
| Last Mountain Valley No. 250 | December 13, 1909 | 275 | 267 | +3.0% | 871.17 | 0.3/km2 |
| Laurier No. 38 | December 13, 1909 | 296 | 321 | −7.8% | 840.4 | 0.4/km2 |
| Lawtonia No. 135 | December 12, 1910 | 346 | 434 | −20.3% | 845.28 | 0.4/km2 |
| Leask No. 464 | December 9, 1912 | 686 | 775 | −11.5% | 1,257.36 | 0.5/km2 |
| Leroy No. 339 | January 1, 1913 | 502 | 490 | +2.4% | 839.29 | 0.6/km2 |
| Lipton No. 217 | December 11, 1911 | 381 | 424 | −10.1% | 813.69 | 0.5/km2 |
| Livingston No. 331 | January 1, 1913 | 281 | 311 | −9.6% | 1,338.85 | 0.2/km2 |
| Lomond No. 37 | December 11, 1911 | 296 | 304 | −2.6% | 833.95 | 0.4/km2 |
| Lone Tree No. 18 | December 8, 1913 | 150 | 145 | +3.4% | 838 | 0.2/km2 |
| Longlaketon No. 219 | December 12, 1910 | 1,016 | 962 | +5.6% | 1,024.59 | 1.0/km2 |
| Loon Lake No. 561 | January 1, 1978 | 756 | 725 | +4.3% | 2,805.1 | 0.3/km2 |
| Loreburn No. 254 | December 12, 1910 | 327 | 346 | −5.5% | 966.78 | 0.3/km2 |
| Lost River No. 313 | December 11, 1911 | 242 | 209 | +15.8% | 549.92 | 0.4/km2 |
| Lumsden No. 189 | December 9, 1912 | 1,938 | 1,772 | +9.4% | 817.13 | 2.4/km2 |
| Manitou Lake No. 442 | December 12, 1910 | 573 | 547 | +4.8% | 850.95 | 0.7/km2 |
| Mankota No. 45 | January 1, 1913 | 292 | 322 | −9.3% | 1,696.35 | 0.2/km2 |
| Maple Bush No. 224 | December 13, 1909 | 192 | 167 | +15.0% | 811.95 | 0.2/km2 |
| Maple Creek No. 111 | December 10, 1917 | 1,068 | 1,154 | −7.5% | 3,243.33 | 0.3/km2 |
| Mariposa No. 350 | December 12, 1910 | 205 | 220 | −6.8% | 636.73 | 0.3/km2 |
| Marquis No. 191 | December 11, 1911 | 297 | 212 | +40.1% | 801.42 | 0.4/km2 |
| Marriott No. 317 | December 12, 1910 | 366 | 372 | −1.6% | 843.29 | 0.4/km2 |
| Martin No. 122 | January 1, 1913 | 289 | 333 | −13.2% | 556.5 | 0.5/km2 |
| Maryfield No. 91 | December 9, 1912 | 324 | 319 | +1.6% | 759.58 | 0.4/km2 |
| Mayfield No. 406 | December 13, 1909 | 377 | 389 | −3.1% | 782.5 | 0.5/km2 |
| McCraney No. 282 | December 13, 1909 | 310 | 307 | +1.0% | 948.55 | 0.3/km2 |
| McKillop No. 220 | December 13, 1909 | 732 | 575 | +27.3% | 668.44 | 1.1/km2 |
| McLeod No. 185 | January 1, 1913 | 365 | 446 | −18.2% | 886.6 | 0.4/km2 |
| Meadow Lake No. 588 | February 1, 1976 | 2,501 | 2,667 | −6.2% | 6,306.17 | 0.4/km2 |
| Medstead No. 497 | January 1, 1913 | 508 | 513 | −1.0% | 1,203.22 | 0.4/km2 |
| Meeting Lake No. 466 | January 1, 1913 | 319 | 376 | −15.2% | 1,066.74 | 0.3/km2 |
| Meota No. 468 | December 13, 1909 | 933 | 936 | −0.3% | 651.06 | 1.4/km2 |
| Mervin No. 499 | January 1, 1913 | 1,256 | 1,224 | +2.6% | 1,594.6 | 0.8/km2 |
| Milden No. 286 | December 12, 1910 | 327 | 283 | +15.5% | 735.29 | 0.4/km2 |
| Milton No. 292 | December 11, 1911 | 241 | 312 | −22.8% | 658.64 | 0.4/km2 |
| Miry Creek No. 229 | January 1, 1913 | 370 | 384 | −3.6% | 1,221.15 | 0.3/km2 |
| Monet No. 257 | December 13, 1909 | 445 | 495 | −10.1% | 1,591.7 | 0.3/km2 |
| Montmartre No. 126 | December 13, 1909 | 483 | 488 | −1.0% | 853.84 | 0.6/km2 |
| Montrose No. 315 | December 13, 1909 | 712 | 712 | 0.0% | 898.38 | 0.8/km2 |
| Moose Creek No. 33 | December 12, 1910 | 379 | 372 | +1.9% | 842.03 | 0.5/km2 |
| Moose Jaw No. 161 | December 11, 1911 | 1,163 | 1,147 | +1.4% | 793.73 | 1.5/km2 |
| Moose Mountain No. 63 | December 11, 1911 | 492 | 475 | +3.6% | 738.38 | 0.7/km2 |
| Moose Range No. 486 | December 11, 1916 | 1,000 | 1,131 | −11.6% | 2,418.7 | 0.4/km2 |
| Moosomin No. 121 | January 1, 1913 | 470 | 504 | −6.7% | 562.01 | 0.8/km2 |
| Morris No. 312 | December 13, 1909 | 290 | 316 | −8.2% | 847.16 | 0.3/km2 |
| Morse No. 165 | December 11, 1911 | 427 | 401 | +6.5% | 1,244.38 | 0.3/km2 |
| Mount Hope No. 279 | December 11, 1911 | 531 | 567 | −6.3% | 1,669.17 | 0.3/km2 |
| Mount Pleasant No. 2 | December 11, 1911 | 414 | 383 | +8.1% | 780.83 | 0.5/km2 |
| Mountain View No. 318 | December 13, 1909 | 337 | 333 | +1.2% | 840.03 | 0.4/km2 |
| Newcombe No. 260 | December 11, 1911 | 342 | 400 | −14.5% | 1,075.6 | 0.3/km2 |
| Nipawin No. 487 | December 9, 1912 | 1,004 | 1,030 | −2.5% | 886.04 | 1.1/km2 |
| North Battleford No. 437 | December 12, 1910 | 725 | 733 | −1.1% | 797.2 | 0.9/km2 |
| North Qu'Appelle No. 187 | December 12, 1910 | 855 | 728 | +17.4% | 494.98 | 1.7/km2 |
| Norton No. 69 | December 13, 1909 | 233 | 259 | −10.0% | 844.8 | 0.3/km2 |
| Oakdale No. 320 | December 13, 1909 | 253 | 258 | −1.9% | 805.92 | 0.3/km2 |
| Old Post No. 43 | January 1, 1967 | 377 | 395 | −4.6% | 1,757 | 0.2/km2 |
| Orkney No. 244 | January 1, 1913 | 1,875 | 1,860 | +0.8% | 806.99 | 2.3/km2 |
| Paddockwood No. 520 | January 1, 1978 | 895 | 974 | −8.1% | 2,456.56 | 0.4/km2 |
| Parkdale No. 498 | January 1, 1913 | 621 | 631 | −1.6% | 1,388.9 | 0.4/km2 |
| Paynton No. 470 | January 1, 1913 | 255 | 268 | −4.9% | 593.95 | 0.4/km2 |
| Pense No. 160 | January 1, 1913 | 508 | 471 | +7.9% | 841.48 | 0.6/km2 |
| Perdue No. 346 | December 13, 1909 | 445 | 463 | −3.9% | 826.14 | 0.5/km2 |
| Piapot No. 110 | December 8, 1913 | 302 | 324 | −6.8% | 1,912.81 | 0.2/km2 |
| Pinto Creek No. 75 | January 1, 1913 | 283 | 239 | +18.4% | 845.49 | 0.3/km2 |
| Pittville No. 169 | January 1, 1913 | 208 | 204 | +2.0% | 1,258.06 | 0.2/km2 |
| Pleasant Valley No. 288 | December 11, 1911 | 302 | 345 | −12.5% | 830.53 | 0.4/km2 |
| Pleasantdale No. 398 | December 11, 1911 | 596 | 611 | −2.5% | 757.91 | 0.8/km2 |
| Ponass Lake No. 367 | January 1, 1913 | 422 | 502 | −15.9% | 750.62 | 0.6/km2 |
| Poplar Valley No. 12 | January 1, 1913 | 195 | 200 | −2.5% | 769.37 | 0.3/km2 |
| Porcupine No. 395 | February 28, 1944 | 803 | 820 | −2.1% | 2,339.96 | 0.3/km2 |
| Prairie Rose No. 309 | December 12, 1910 | 220 | 259 | −15.1% | 839.08 | 0.3/km2 |
| Prairiedale No. 321 | December 13, 1909 | 247 | 253 | −2.4% | 546.74 | 0.5/km2 |
| Preeceville No. 334 | January 1, 1913 | 919 | 859 | +7.0% | 1,394.5 | 0.7/km2 |
| Prince Albert No. 461 | December 9, 1912 | 3,562 | 3,601 | −1.1% | 1,017.44 | 3.5/km2 |
| Progress No. 351 | December 12, 1910 | 268 | 260 | +3.1% | 802.06 | 0.3/km2 |
| Reciprocity No. 32 | December 11, 1911 | 344 | 386 | −10.9% | 733.04 | 0.5/km2 |
| Redberry No. 435 | January 1, 1913 | 342 | 372 | −8.1% | 1,015.2 | 0.3/km2 |
| Redburn No. 130 | January 1, 1913 | 250 | 250 | 0.0% | 847.95 | 0.3/km2 |
| Reford No. 379 | December 12, 1910 | 257 | 235 | +9.4% | 707.06 | 0.4/km2 |
| Reno No. 51 | December 11, 1911 | 379 | 399 | −5.0% | 3,461.61 | 0.1/km2 |
| Riverside No. 168 | January 1, 1913 | 477 | 490 | −2.7% | 1,298.39 | 0.4/km2 |
| Rocanville No. 151 | December 9, 1912 | 507 | 533 | −4.9% | 758.48 | 0.7/km2 |
| Rodgers No. 133 | December 9, 1912 | 90 | 101 | −10.9% | 719.8 | 0.1/km2 |
| Rosedale No. 283 | December 13, 1909 | 526 | 515 | +2.1% | 921.51 | 0.6/km2 |
| Rosemount No. 378 | December 12, 1910 | 201 | 198 | +1.5% | 571.35 | 0.4/km2 |
| Rosthern No. 403 | December 9, 1912 | 2,300 | 2,015 | +14.1% | 954.22 | 2.4/km2 |
| Round Hill No. 467 | December 11, 1911 | 361 | 446 | −19.1% | 816.12 | 0.4/km2 |
| Round Valley No. 410 | December 13, 1909 | 423 | 361 | +17.2% | 810.57 | 0.5/km2 |
| Rudy No. 284 | December 13, 1909 | 466 | 471 | −1.1% | 813.86 | 0.6/km2 |
| Saltcoats No. 213 | December 9, 1912 | 712 | 673 | +5.8% | 830.58 | 0.9/km2 |
| Sarnia No. 221 | December 13, 1909 | 322 | 266 | +21.1% | 870.73 | 0.4/km2 |
| Saskatchewan Landing No. 167 | January 1, 1913 | 415 | 462 | −10.2% | 797.52 | 0.5/km2 |
| Sasman No. 336 | January 1, 1913 | 765 | 818 | −6.5% | 1,006.49 | 0.8/km2 |
| Scott No. 98 | December 13, 1909 | 195 | 176 | +10.8% | 850.08 | 0.2/km2 |
| Senlac No. 411 | January 1, 1913 | 216 | 195 | +10.8% | 1,026.75 | 0.2/km2 |
| Shamrock No. 134 | December 9, 1912 | 205 | 227 | −9.7% | 757.52 | 0.3/km2 |
| Shellbrook No. 493 | January 1, 1913 | 1,587 | 1,533 | +3.5% | 1,235.75 | 1.3/km2 |
| Sherwood No. 159 | December 11, 1911 | 974 | 879 | +10.8% | 656.87 | 1.5/km2 |
| Silverwood No. 123 | October 31, 1911 | 410 | 466 | −12.0% | 844.61 | 0.5/km2 |
| Sliding Hills No. 273 | January 1, 1913 | 421 | 520 | −19.0% | 855.28 | 0.5/km2 |
| Snipe Lake No. 259 | December 11, 1911 | 396 | 452 | −12.4% | 1,573.8 | 0.3/km2 |
| Souris Valley No. 7 | December 13, 1909 | 249 | 240 | +3.8% | 817.52 | 0.3/km2 |
| South Qu'Appelle No. 157 | August 6, 1884 | 1,275 | 1,271 | +0.3% | 889.72 | 1.4/km2 |
| Spalding No. 368 | December 11, 1911 | 453 | 447 | +1.3% | 811.47 | 0.6/km2 |
| Spiritwood No. 496 | December 9, 1929 | 1,347 | 1,349 | −0.1% | 2,392.86 | 0.6/km2 |
| Spy Hill No. 152 | December 11, 1911 | 323 | 366 | −11.7% | 679.33 | 0.5/km2 |
| St. Andrews No. 287 | December 12, 1910 | 522 | 532 | −1.9% | 803.75 | 0.6/km2 |
| St. Louis No. 431 | January 1, 1913 | 1,086 | 969 | +12.1% | 790.93 | 1.4/km2 |
| St. Peter No. 369 | December 11, 1911 | 773 | 790 | −2.2% | 823.21 | 0.9/km2 |
| St. Philips No. 301 | January 1, 1913 | 220 | 235 | −6.4% | 655.78 | 0.3/km2 |
| Stanley No. 215 | January 1, 1913 | 505 | 516 | −2.1% | 855.4 | 0.6/km2 |
| Star City No. 428 | January 1, 1913 | 918 | 911 | +0.8% | 824.85 | 1.1/km2 |
| Stonehenge No. 73 | December 11, 1911 | 319 | 403 | −20.8% | 985.74 | 0.3/km2 |
| Storthoaks No. 31 | December 11, 1911 | 292 | 304 | −3.9% | 584.16 | 0.5/km2 |
| Surprise Valley No. 9 | January 1, 1913 | 217 | 251 | −13.5% | 813.93 | 0.3/km2 |
| Sutton No. 103 | December 11, 1911 | 240 | 240 | 0.0% | 822.4 | 0.3/km2 |
| Swift Current No. 137 | December 12, 1910 | 1,932 | 1,981 | −2.5% | 1,102.43 | 1.8/km2 |
| Tecumseh No. 65 | December 13, 1909 | 271 | 270 | +0.4% | 824.5 | 0.3/km2 |
| Terrell No. 101 | January 1, 1913 | 241 | 224 | +7.6% | 864.06 | 0.3/km2 |
| The Gap No. 39 | December 12, 1903 | 199 | 230 | −13.5% | 830.92 | 0.2/km2 |
| Three Lakes No. 400 | January 1, 1913 | 598 | 620 | −3.5% | 772.49 | 0.8/km2 |
| Tisdale No. 427 | December 9, 1912 | 911 | 916 | −0.5% | 847.39 | 1.1/km2 |
| Torch River No. 488 | January 1, 1950 | 1,471 | 1,468 | +0.2% | 5,178.9 | 0.3/km2 |
| Touchwood No. 248 | December 12, 1910 | 343 | 267 | +28.5% | 706.72 | 0.5/km2 |
| Tramping Lake No. 380 | December 12, 1910 | 375 | 410 | −8.5% | 615.56 | 0.6/km2 |
| Tullymet No. 216 | January 1, 1913 | 200 | 220 | −9.1% | 562.99 | 0.4/km2 |
| Turtle River No. 469 | December 9, 1912 | 344 | 360 | −4.4% | 664.44 | 0.5/km2 |
| Usborne No. 310 | December 13, 1909 | 529 | 547 | −3.3% | 810.38 | 0.7/km2 |
| Val Marie No. 17 | January 1, 1969 | 413 | 420 | −1.7% | 3,105.26 | 0.1/km2 |
| Vanscoy No. 345 | December 13, 1909 | 2,840 | 2,714 | +4.6% | 865.49 | 3.3/km2 |
| Victory No. 226 | December 8, 1919 | 380 | 443 | −14.2% | 1,375.44 | 0.3/km2 |
| Viscount No. 341 | December 13, 1909 | 338 | 371 | −8.9% | 831.23 | 0.4/km2 |
| Wallace No. 243 | December 11, 1911 | 852 | 879 | −3.1% | 830.24 | 1.0/km2 |
| Walpole No. 92 | December 12, 1910 | 326 | 338 | −3.6% | 844.66 | 0.4/km2 |
| Waverley No. 44 | February 1, 1913 | 336 | 359 | −6.4% | 1,429.3 | 0.2/km2 |
| Wawken No. 93 | January 1, 1913 | 571 | 559 | +2.1% | 766.57 | 0.7/km2 |
| Webb No. 138 | December 13, 1909 | 541 | 533 | +1.5% | 1,098.78 | 0.5/km2 |
| Wellington No. 97 | December 13, 1909 | 371 | 356 | +4.2% | 838.68 | 0.4/km2 |
| Weyburn No. 67 | December 13, 1909 | 1,064 | 1,048 | +1.5% | 808.33 | 1.3/km2 |
| Wheatlands No. 163 | December 13, 1909 | 149 | 149 | 0.0% | 827.4 | 0.2/km2 |
| Whiska Creek No. 106 | January 1, 1913 | 465 | 499 | −6.8% | 851.89 | 0.5/km2 |
| White Valley No. 49 | January 1, 1913 | 478 | 478 | 0.0% | 2,026.88 | 0.2/km2 |
| Willner No. 253 | January 1, 1913 | 255 | 245 | +4.1% | 835.03 | 0.3/km2 |
| Willow Bunch No. 42 | November 21, 1912 | 306 | 361 | −15.2% | 1,047.77 | 0.3/km2 |
| Willow Creek No. 458 | December 9, 1912 | 630 | 693 | −9.1% | 845.18 | 0.7/km2 |
| Willowdale No. 153 | January 1, 1913 | 299 | 297 | +0.7% | 604.13 | 0.5/km2 |
| Wilton No. 472 | December 13, 1909 | 1,629 | 1,494 | +9.0% | 1,041.27 | 1.6/km2 |
| Winslow No. 319 | December 13, 1909 | 344 | 324 | +6.2% | 798.07 | 0.4/km2 |
| Wise Creek No. 77 | January 1, 1913 | 205 | 157 | +30.6% | 845.81 | 0.2/km2 |
| Wolseley No. 155 | December 13, 1909 | 372 | 405 | −8.1% | 774.26 | 0.5/km2 |
| Wolverine No. 340 | December 13, 1909 | 480 | 464 | +3.4% | 834.78 | 0.6/km2 |
| Wood Creek No. 281 | December 13, 1909 | 224 | 205 | +9.3% | 832.34 | 0.3/km2 |
| Wood River No. 74 | December 9, 1912 | 433 | 324 | +33.6% | 838.45 | 0.5/km2 |
| Wreford No. 280 | December 12, 1910 | 135 | 150 | −10.0% | 798.55 | 0.2/km2 |
| Total rural municipalities | — | 176,535 | 174,601 | +1.1% | 307,649.16 | 0.6/km2 |
Northern municipalities

Saskatchewan has 24 northern municipalities, which includes the sub-types of northern towns, northern villages and northern hamlets.[1]
Northern towns
A northern town is a town in the Northern Saskatchewan Administration District. Its administration is regulated by The Northern Municipalities Act.[5] A northern village may apply for town status when the actual resident population is at least 500.
Saskatchewan has two northern towns.[1]
| Northern towns of Saskatchewan | ||||||
|---|---|---|---|---|---|---|
| Name[23] | Incorporation date[24] |
Population (2011)[6][25] |
Population (2006)[6] |
Change (%)[6] |
Land area (km²)[6] |
Population density (per km²)[6] |
| Total northern towns | — | 4,241 | 4,227 | 0.3 | 26.25 | 161.6 |
Northern villages
A northern village is located in the Northern Saskatchewan Administration District, and its administration is regulated by The Northern Municipalities Act.[5] A northern hamlet may apply for northern village status when the population is at least 100 and the northern hamlet contains at least 50 separate dwelling units or business premises.
Saskatchewan has 11 northern villages.[1]
| Northern villages of Saskatchewan | ||||||
|---|---|---|---|---|---|---|
| Name[23] | Incorporation date[24] |
Population (2011)[6][25] |
Population (2006)[6] |
Change (%)[6] |
Land area (km²)[6] |
Population density (per km²)[6] |
| Total northern villages | — | 11,998 | 11,414 | 5.1 | 289.61 | 41.4 |
Northern hamlets
A northern hamlet is located in the Northern Saskatchewan Administration District, and its administration is regulated by The Northern Municipalities Act.[5] A northern settlement may apply for northern hamlet status when the population is at least 50 and the northern settlement contains at least 25 separate dwelling units or business premises. Unlike hamlets and northern settlements, northern hamlets are municipal corporations.
Saskatchewan has 11 northern hamlets.[1]
| Northern hamlets of Saskatchewan | ||||||
|---|---|---|---|---|---|---|
| Name[23] | Incorporation date[24] |
Population (2011)[6][23][25] |
Population (2006)[6] |
Change (%)[6] |
Land area (km²)[6] |
Population density (per km²)[6] |
| Total northern hamlets | — | 1,372 | 1,157 | 18.6 | 46.67 | 29.4 |
Unincorporated hamlets
In Saskatchewan, a hamlet is an unincorporated community that is under the jurisdiction of a rural municipality.[26] It has at least five occupied dwellings situated on separate lots and at least 10 separate lots, the majority of which are an average size of less than one acre.[2]
The Government of Saskatchewan recognizes three different types of hamlets – generic "hamlets", "special service areas" and "organized hamlets".[26] Some organized hamlets in Saskatchewan are recognized as designated places by Statistics Canada, while unorganized hamlets are not.
Hamlets
Generic hamlets in Saskatchewan are under the jurisdiction of a rural municipality and do not have any decision-making powers or independent authorities.[26]
The following are hamlets that are neither special service areas nor organized hamlets.
- Alticane
- Anglin Lake
- Ardath
- Ardill
- Ardwick
- Arelee
- Armley
- Armour Siding
- Avonhurst
- Baildon
- Baldwinton
- Baljennie
- Bapaume
- Baring
- Barthel
- Bateman
- Batoche
- Battrum
- Beacon Hill
- Beadle
- Beaufield (originally named Ednaburg)
- Bechard
- Benito Beach
- Benson
- Berth
- Bertwell
- Besant
- Beverley
- Big Shell
- Birch Lake
- Bird's Point
- Birmingham
- Birsay
- Blackstrap
- Blucher
- Blumenheim
- Blumenhof
- Blumenort
- Bodmin
- Boharm
- Boundary Dam Lake
- Bounty
- Brada
- Bremen
- Bresaylor
- Bridgeford
- Broadacres
- Bromhead
- Brooksby
- Browning
- Buffalo Gap
- Burr
- Burrows
- Bushell Park
- Cactus Lake
- Canora Beach
- Cardross
- Carlea
- Carlton
- Cedoux
- Chamakese
- Chitek
- Chorney Beach
- Chortitz
- Clair
- Clemenceau
- Colfax
- Coop
- Coothill
- Copper Sands
- Corinne
- Cory
- Courval
- Crane Valley
- Crane
- Crooked River
- Crystal Beach
- Danbury
- D'Arcy
- Davis
- Divide
- Dollard
- Donavon (Birdview)
- Duperow (Lydden)
- Duvco
- Edenburg
- Eldersley
- Emma Lake
- Endeavour (Annette)
- England
- Espeseth Cove (Pelican Shores)
- Expanse (former name of Lake Johnston)
- Ferguson Bay
- Fertile
- Fielding
- Fife Lake
- Fir Mountain
- Flintoft
- Floral
- Flotten Lake
- Forgan
- Foxford
- Fulda
- Furness
- Girvin
- Glenbain (Glen Bain)
- Grandora
- Grasswood
- Grenfell Beach
- Griffin
- Guise Beach
- Handel
- Harptree
- Herschel
- Hochstadt
- Hoosier
- Howe Bay
- Inchkeith
- Indian Point
- Insinger
- Instow
- Isham
- Jackfish Lake
- Jan Lake
- Jasmin
- Jedburgh
- Kayville
- KC Beach
- Kedleston Beach
- Keeley Lake
- Kinookimaw
- Kuroki Beach
- Lac La Peche
- Lac La Plonge
- Lady Lake
- Langbank
- Laporte
- Laura
- Leacross
- Liebenthal
- Lipp's Beach
- Little Amyot Lake
- Loch Leven
- Lorlie
- Madge Lake
- Main Centre
- Mainprize
- Mantario
- McGee
- McIntosh Point
- Meyronne
- Mikado
- Mission Lake Subdivision
- Mont Nebo
- Moose Range
- Mount Carmel (Grosse Butte)
- Murray Point
- Neidpath
- Neis Beach
- Nelson Beach
- Nemeiben Lake
- Northgate
- Okema Beach
- Old Man on His Back Shortgrass Prairie and Heritage Preserve
- Onion Lake
- Oungre
- Parkbeg
- Parkerview (Crowtherview)
- Penzance
- Percival
- Piapot
- Red Deer Hill (originally named Aaskana)
- Redwing
- Reward
- Robsart
- Ruby Lake Beach
- St. Front
- Schantzenfeld
- Schoenfeld
- Serath
- Shipman
- Simmie
- Sonningdale
- South Fork
- Sovereign
- Spring Valley
- Springfeld
- Spruce Home
- St. Denis
- Stalwart
- Steelman
- Stony Beach
- Stranraer
- Swanson
- Tarnopol
- Truax
- Uren
- Vantage
- Veregin
- Viceroy
- West Bend
- Wroxton
- Xena
- Zehner
- Zeneta
Special service areas
Like a generic hamlet, a special service area is under the jurisdiction of a rural municipality and does not have any decision-making powers or independent authorities. Unlike a generic hamlet, a special service area may form its own electoral division within the rural municipality and may have a different tax regime within the rural municipality compared to a generic hamlet.[26]
| Special service areas of Saskatchewan | ||
|---|---|---|
| Name[23] | Rural municipality (RM) |
Population (2011)[27] |
| Alsask | Milton No. 292 | 131 |
| Aneroid | Auvergne No. 76 | 40 |
| Antler | Antler No. 61 | 41[6] |
| Crooked River | Bjorkdale No. 426 | 40 |
| Domremy | St. Louis No. 431 | 125 |
| Griffin | Griffin No. 66 | 64 |
| Herschel | Mountain View No. 318 | 39 |
| Leslie | Foam Lake No. 276 | 15 |
| Mantario | Chesterfield No. 261 | 5 |
| Meyronne | Chesterfield No. 261 | 36 |
| Penzance | Sarnia No. 221 | 25 |
| Rockhaven | Cut Knife No. 439 | 20 |
| Sovereign | St. Andrews No. 287 | 26 |
| Springwater | Biggar No. 347 | 15 |
| Stornoway | Wallace No. 243 | 0[28] |
| Veregin | Sliding Hills No. 273 | 70 |
| Willowbrook | Orkney No. 244 | 35 |
| Yellow Creek | Invergordon No. 430 | 73 |
Organized hamlets
Saskatchewan has 151 organized hamlets that are established via ministerial order and under the jurisdiction of rural municipalities within southern and central Saskatchewan.[19] The people in a hamlet may apply for organized hamlet status within the rural municipality in which the hamlet is located. The minimum requirements for organize status include a permanent population of at least 80 residents, 40 separate dwelling units or places of business, a taxable assessment of at least $4 million, and any other factor the minister may consider appropriate.[29]
| Organized hamlets of Saskatchewan | |
|---|---|
| Name[30] | Rural municipality (RM)[30] |
| Alta Vista | McKillop No. 220 |
| Amsterdam | Buchanan No. 304 |
| Arlington Beach | Last Mountain Valley No. 250 |
| Balone Beach | Hoodoo No. 401 |
| Barrier Ford | Bjorkdale No. 426 |
| Bayard | Terrell No. 101 |
| Bayview Heights | Meota No. 468 |
| Beaubier | Lake Alma No. 8 |
| Beaver Creek | Corman Park No. 344 |
| Bellegarde | Storthoaks No. 31 |
| Big Beaver | Happy Valley No. 10 |
| Blumenthal | Rosthern No. 403 |
| Brancepeth | Birch Hills No. 460 |
| Burgis Beach | Good Lake No. 274 |
| Candiac | Montmartre No. 126 |
| Cannington Lake | Wawken No. 93 |
| Caron | Caron No. 162 |
| Casa Rio | Corman Park No. 344 |
| Cathedral Bluffs | Corman Park No. 344 |
| Cedar Villa Estates | Corman Park No. 344 |
| Chelan | Bjorkdale No. 426 |
| Claybank | Elmsthorpe No. 100 |
| Colesdale Park | McKillop No. 220 |
| Collingwood Lakeshore Estates | McKillop No. 220 |
| Congress | Stonehenge No. 73 |
| Corning | Golden West No. 95 |
| Crawford Estates | Edenwold No. 158 |
| Crutwell | Shellbrook No. 493 |
| Crystal Bay-Sunset | Mervin No. 499 |
| Crystal Lake | Keys No. 303 |
| Crystal Springs | Invergordon No. 430 |
| Cudsaskwa Beach | Hoodoo No. 401 |
| Darlings Beach | Lac Pelletier No. 107 |
| Davin | Lajord No. 128 |
| Day's Beach | Meota No. 468 |
| Deer Valley | Lumsden No. 189 |
| Delmas | Battle River No. 438 |
| Demaine | Victory No. 226 |
| Discovery Ridge | Corman Park No. 344 |
| Eagle Ridge Country Estates | Corman Park No. 344 |
| Edgeley | South Qu'Appelle No. 157 |
| Elbow Lake | Hudson Bay No. 394 |
| Elk Ridge | Lakeland No. 521 |
| Erwood | Hudson Bay No. 394 |
| Evergreen Acres | Mervin No. 499 |
| Evergreen Brightsand | Mervin No. 499 |
| Exner's Twin Bays | Grayson No. 184 |
| Fairholme | Parkdale No. 498 |
| Fairy Glen | Willow Creek No. 458 |
| Fiske | Pleasant Valley No. 288 |
| Frenchman Butte | Frenchman Butte No. 501 |
| Furdale | Corman Park No. 344 |
| Garrick | Torch River No. 488 |
| Good Spirit Acres | Good Lake No. 274 |
| Gray | Lajord No. 128 |
| Greenspot | Grayson No. 184 |
| Gronlid | Willow Creek No. 458 |
| Guernsey | Usborne No. 310 |
| Hagen | Birch Hills No. 460 |
| Hazel Dell | Hazel Dell No. 335 |
| Hendon | Lakeview No. 337 |
| Hitchcock Bay | Coteau No. 255 |
| Hoey | St. Louis No. 431 |
| Holbein | Shellbrook No. 493 |
| Horseshoe Bay | Parkdale No. 498 |
| Kandahar | Big Quill No. 308 |
| Ketchen | Preeceville No. 334 |
| Kopp's Kove | Mervin No. 499 |
| Kronau | Lajord No. 128 |
| Kuroki | Sasman No. 336 |
| Lakeview | Meota No. 468 |
| Lanz Point | Meota No. 468 |
| Little Fishing Lake | Loon Lake No. 561 |
| Little Swan River | Hudson Bay No. 394 |
| Livelong | Mervin No. 499 |
| Lone Rock | Wilton No. 472 |
| MacDowall | Duck Lake No. 463 |
| MacPheat Park | McKillop No. 220 |
| Martinson's Beach | Meota No. 468 |
| Mayfair | Meeting Lake No. 466 |
| Maymont Beach | Meota No. 468 |
| McCord | Mankota No. 45 |
| Merrill Hills | Corman Park No. 344 |
| Meskanaw | Invergordon No. 430 |
| Mohr's Beach | McKillop No. 220 |
| Moose Bay | Grayson No. 184 |
| Mowrey Beach | Mervin No. 499 |
| Mozart | Elfros No. 307 |
| Mullingar | Meeting Lake No. 466 |
| Nesslin Lake | Big River No. 555 |
| Neuanlage | Rosthern No. 403 |
| Neuhorst | Corman Park No. 344 |
| North Colesdale Park | McKillop No. 220 |
| North Shore Fishing Lake | Sasman No. 336 |
| North Weyburn | Weyburn No. 67 |
| Northside | Paddockwood No. 520 |
| Okla | Hazel Dell No. 335 |
| Ormiston | Lake of the Rivers No. 72 |
| Ottman-Murray Beach | Sasman No. 336 |
| Parkland Beach | Mervin No. 499 |
| Parkview | Marquis No. 191 |
| Parry | Caledonia No. 99 |
| Pasqua Lake | North Qu'Appelle No. 187 |
| Peebles | Chester No. 125 |
| Pelican Cove | Leask No. 464 |
| Pelican Point | Meota No. 468 |
| Pelican Shores | Fertile Belt No. 183 |
| Phillips Grove | Big River No. 555 |
| Powm Beach | Mervin No. 499 |
| Prairie River | Porcupine No. 395 |
| Prince | Meota No. 468 |
| Riceton | Lajord No. 128 |
| River's Edge | Corman Park No. 344 |
| Riverside Estates | Corman Park No. 344 |
| Runnymede | Cote No. 271 |
| Sarnia Beach | Sarnia No. 221 |
| Scout Lake | Willow Bunch No. 42 |
| Sleepy Hollow | Meota No. 468 |
| Snowden | Torch River No. 488 |
| Sorensen Beach | McKillop No. 220 |
| South Waterhen Lake | Meadow Lake No. 588 |
| Spring Bay | McKillop No. 220 |
| Spruce Bay | Spiritwood No. 496 |
| Spruce Lake | Mervin No. 499 |
| St. Isidore-de-Bellevue | St. Louis No. 431 |
| St. Joseph's | South Qu'Appelle No. 157 |
| Summerfield Beach | Meota No. 468 |
| Sunset Beach | Grayson No. 184 |
| Sunset View Beach | Mervin No. 499 |
| Swan Plain | Clayton No. 333 |
| Sylvania | Tisdale No. 427 |
| Tadmore | Buchanan No. 304 |
| Taylor Beach | North Qu'Appelle No. 187 |
| Trevessa Beach | Meota No. 468 |
| Trossachs | Brokenshell No. 68 |
| Tuffnell | Foam Lake No. 276 |
| Turtle Lake South Bay | Mervin No. 499 |
| Tway | Invergordon No. 430 |
| Uhl's Bay | McKillop No. 220 |
| Usherville | Preeceville No. 334 |
| West Chatfield Beach | Meota No. 468 |
| Westview | Stanley No. 215 |
| Wishart | Emerald No. 277 |
| Wymark | Swift Current No. 137 |
Northern settlements
A northern settlement is an unincorporated community in the Northern Saskatchewan Administration District, and its administration is regulated by The Northern Municipalities Act.[5]
Saskatchewan has 11 northern settlements.[1]
| Northern settlements of Saskatchewan | ||
|---|---|---|
| Name[23] | Rural municipality (RM) |
Population (2011)[6][23] |
| Bear Creek | — | 47 |
| Brabant Lake | — | 102 |
| Camsell Portage | — | 37 |
| Descharme Lake | — | 42 |
| Garson Lake | — | 34 |
| Missinipe | — | 39[6] |
| Sled Lake | — | 35 |
| Southend | — | 35 |
| Stanley Mission | — | 124 |
| Uranium City | — | 201 |
| Wollaston Lake | — | 129 |
| Total northern settlements | 825 | |
Ghost towns
A ghost town is a town that once had a considerable population, that has since dwindled in numbers causing some or all of its businesses and services to close, either due to the rerouting of a highway, railway tracks being pulled, or exhaustion of some natural resource.
| Ghost towns of Saskatchewan | |||
|---|---|---|---|
| Name | Rural municipality (RM) |
Land Address | Lat/Long |
| Amulet | Norton No. 16 | 49°36'58.3" N 104°45'19.4 "W | |
| Arena | Frontier No. 19 | 49°07'2.3" N 109°16'00.1" W | |
| Baildon | Baildon No. 131 | ||
| Bateman | Gravelbourg No. 104 | 49°41′28.9″ N 107°51′14.6″ W | |
| Battrum | Riverside No. 168 | 50°32'55.0" N 108°20'05.3" W | |
| Bayard | Terrell No. 101 | 50°01'18.8" N 105°17'27.2" W | |
| Bents | Marriott No. 317 | 51°49'24.2" N 107°43'43.0" W | |
| Birch Creek | Emerald No. 277 | Sec.10, Twp.30, R.14, W2 | |
| Blewett | Cymri No. 36 | SW Sec.12, Twp.5, R.10, W2 | 49°21'58.41" N 103°14'02.23" W |
| Bonne Madone | Hoodoo No. 401 | 50°40'0.3" N 105°29'3.7" W | |
| Bounty | Fertile Valley No. 285 | 51°31'20.9" N 107°21'41.7" W | |
| Breeze | Browning No. 34 | ||
| Bresaylor | Paynton No. 470 | 52°58'06.6" N 108°45'49.3" W | |
| Bromhead | Souris Valley No. 7 | Sec.3, Twp.3, R.13, W2 | 49°10'46.9" N -103°40'34.7" W |
| Brooking | Laurier No. 38 | 49°30'34.7" N 104°25'21.3" W | |
| Browning | Browning No. 34 | 49°26'07.8" N 102°38'02.4" W | |
| Bryant | Benson No. 35 | SW Sec.12 Twp.5 R.9, W2 | 49°22'37.7" N 103°06'16.4" W |
| Buffalo Gap | 49°06'31.7" N 105°16'41.5" W | ||
| Cactus Lake | Heart's Hill No. 352 | ||
| Castlewood | Biggar No. 347 | ||
| Canuck | Lone Tree No. 18 | ||
| Chandler | Cymri No. 36 | SW Sec.10, Twp.5, R.11, W2 | 49°21'48.7" N 103°25'08.4" W |
| Claydon | Frontier No. 19 | ||
| Clearfield | Brokenshell No. 68 | ||
| Coalfields | Coalfields No. 4 | ||
| Colgate | Lomond No. 37 | SE Sec.24 Twp.5 R.15, W2 | 49°23'40.0" N 103°53'42.0" W |
| Court | Antelope Park No. 322 | ||
| Crichton | Wise Creek No. 77 | ||
| Cullen | Benson No. 35 | NW-SW Sec.7 Twp.5 R.7, W2 | 49°22'09.3" N 102°56'52.2" W |
| Cummings | Maple Creek No. 111 | ||
| Diana | Bratt's Lake No. 129 | ||
| Divide | Reno No. 51 | ||
| Dernic (Federal Grain Spur) | Buchanan No. 304 | ||
| Dneiper | Sliding Hills No. 273 | ||
| Dobrowody | Invermay No. 305 | ||
| Dummer | Caledonia No. 99 | ||
| Elcott | Enniskillen No. 3 | ||
| Elswick | Cymri No. 36 | NW Sec.2 Twp.5 R.12, W2 | 49°22'00.0" N 103°32'02.0" W |
| Estuary | Deer Forks No. 232 | ||
| Expanse | Lake Johnston No. 102 | ||
| Flintoft | Stonehenge No. 73 | ||
| Floral | Corman Park No. 344 | Sec.4 Twp.36 R.4, W3 | 52°03′25″ N 106°30′40″ W |
| Forget | Tecumseh No. 65 | ||
| Forward | Norton No. 69 | ||
| Froude | Griffin No. 66 | ||
| Fusilier | Antelope Park No. 322 | ||
| Garwood | Weyburn No. 67 | ||
| Galilee | Terrell No. 101 | ||
| Gallivan | Cut Knife No. 439 | ||
| Gibbs | Longlaketon No. 219 | ||
| Girvin | Arm River No. 252 | ||
| Glamis | St. Andrews No. 287 | ||
| Glasnevin | 49°33'00.9" N 105°03'17.7" W | ||
| Glen Bain | Glen Bain No. 105 | ||
| Glen Kerr | Morse No. 165 | ||
| Goodwater | Lomond No. 37 | 49°23'46.6" N 103°42'36.8" W | |
| Gouldtown | Morse No. 165 | ||
| Gouverneur | Auvergne No. 76 | ||
| Govenlock | Reno No. 51 | ||
| Grassdale | Weyburn No. 67 | ||
| Halkett | Estevan No. 5 | ||
| Hallonquist | Coulee No. 136 | ||
| Handsworth | Golden West No. 95 | ||
| Hardy | The Gap No. 39 | ||
| Harptree | Bengough No. 40 | ||
| Hatton | Maple Creek No. 111 | ||
| Hearne | Redburn No. 130 | ||
| Herschel | Mountain View No. 318 | ||
| Hoffer | Souris Valley No. 7 | ||
| Holloway | Cymri No. 36 | NW Sec.1 Twp.6 R.12, W2 | |
| Horizon | Bengough No. 40 | ||
| Hughton | Monet No. 257 | ||
| Hume | Griffin No. 66 | ||
| Huntoon | Griffin No. 66 | ||
| Innes | Griffin No. 66 | ||
| Insinger | Insinger No. 275 | ||
| Instow | Bone Creek No. 108 | ||
| Island Falls | 55°31'38.0" N 102°20'53.8" W | ||
| Jasmin | Ituna Bon Accord No. 246 | ||
| Jordan River | Arborfield No. 456 | ||
| Kayville | Key West No. 70 | ||
| Kingsford | Browning No. 34 | ||
| Lakenheath | Stonehenge No. 73 | ||
| Lillestrom | Hillsborough No. 132 | 50°15'57.6" N 105°51'19.8" W | |
| Loomis | Frontier No. 19 | ||
| Loverna | Antelope Park No. 322 | ||
| Luxton | Browning No. 34 | ||
| Masefield | Val Marie No. 17 | ||
| Maxim | Lomond No. 37 | NE Sec.21 Twp. 4 R.15, W2 | 49°18'58.7" N 103°58'43.9" W |
| Minard | Browning No. 34 | ||
| Nashlyn | Reno No. 51 | ||
| Neidpath | Coulee No. 136 | ||
| Neptune | Lomond No. 37 | 49°22'21.4" N 104°04'08.8" W | |
| Neville | Whiska Creek No. 106 | ||
| New Finland | Willowdale No. 153 | ||
| Old Wives | Hillsborough No. 132 | 50°11'36.6" N 106°00'21.6" W | |
| Oungre | Souris Valley No. 7 | 49°08'42.7"N 103°48'02.9"W | |
| Oxarat | Reno No. 51 | ||
| Parkbeg | Wheatlands No. 163 | ||
| Pinto | Coalfields No. 4 | ||
| Polwarth | Canwood No. 494 | ||
| Rangeview | Reno No. 51 | ||
| Ravenscrag | White Valley No. 49 | ||
| Reynaud | Three Lakes No. 400 | ||
| Robinhood | Medstead No. 497 | ||
| Robsart | Reno No. 51 | ||
| Romance | Leroy No. 339 | ||
| Roseray | Pittville No. 169 | ||
| Rutland | Colonsay No. 342 | ||
| Scotsguard | Bone Creek No. 108 | ||
| Senate | Reno No. 51 | ||
| Service | Moose Mountain No. 63 | ||
| Shand | Estevan No. 5 | ||
| Smuts | Grant No. 372 | ||
| South Fork | Arlington No. 79 | ||
| Southall | Souris Valley No. 7 | ||
| St. Boswells | Glen Bain No. 105 | ||
| Tableland | Estevan No. 5 | ||
| Tarnopol | Invergordon No. 430 | ||
| Tatagwa | Weyburn No. 67 | NW Sec.17 Twp.8 R.15, W2 | |
| Tate | Mount Hope No. 279 | ||
| Tiny | Buchanan No. 304 | ||
| Taylorton | Coalfields No. 4 | ||
| Trossachs | Brokenshell No. 68 | 49°38'16.8"N 104°13'34.7"W | |
| Truax | Elmsthorpe No. 100 | ||
| Union Jack | Weyburn No. 67 | ||
| Uren | Chaplin No. 164 | ||
| Valjean | Chaplin No. 164 | ||
| Valley Centre | Marriott No. 317 | ||
| Vantage | Sutton No. 103 | ||
| Verlo | Pittville No. 169 | ||
| Vesper | Lac Pelletier No. 107 | ||
| Vidora | Reno No. 51 | ||
| Viewfield | Benson No. 35 | SW S.34 Twp.6 R.9, W2 and NW Sec.27 Twp 6 R.9, W2 | 49°30'22.8" N 103°08'34.0" W |
| Wauchope | Antler No. 61 | ||
| Winter | Round Valley No. 410 | ||
| Woodley | Browning No. 34 | ||
| Xena | Morris No. 312 | ||
| Yonker | Senlac No. 411 | ||
First Nations communities
Indian reserves
Metis settlements
See also
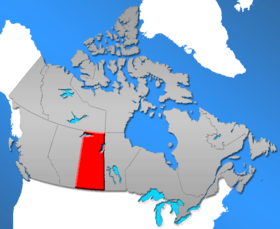
- List of cities in Saskatchewan
- List of ghost towns in Saskatchewan
- List of hamlets in Saskatchewan
- List of Indian reserves in Saskatchewan
- List of municipalities in Saskatchewan
- List of resort villages in Saskatchewan
- List of rural municipalities in Saskatchewan
- List of towns in Saskatchewan
- List of villages in Saskatchewan
Notes
- The balance of Flin Flon is located within Manitoba.
- This population does not include 5,363 in the Manitoba portion of Flin Flon. The city's total population in 2011 was 5,592.
- This area does not include 13.88 km2 (5.36 sq mi) in the Manitoba portion of Flin Flon. The city's total area in 2011 was 16.25 km2 (6.27 sq mi).
- The balance of Lloydminster is located within Alberta.
- This population does not include 18,032 in the Alberta portion of Lloydminster. The city's total population in 2011 was 27,804.
- This area does not include 24.19 km2 (9.34 sq mi) in the Alberta portion of Lloydminster. The city's total area in 2011 was 41.53 km2 (16.03 sq mi).
- Martensville is Saskatchewan's smallest city by area.
- Melville is Saskatchewan's smallest city by population.
- Regina is Saskatchewan's capital and was its first city, incorporated June 19, 1903. The Regina census metropolitan area (CMA) is formed around the City of Regina.
- Saskatoon is Saskatchewan's largest city by both population and area. The Saskatoon CMA includes the cities of Martensville and Saskatoon.
- Warman is Saskatchewan's newest city, incorporated October 27, 2012.
References
- "Types of Municipalities". Saskatchewan Ministry of Municipal Affairs. Archived from the original on September 19, 2012. Retrieved December 12, 2012.
- Saskatchewan Queen's Printer. "The Municipalities Act". Retrieved 2008-02-09.
- Saskatchewan Queen's Printer. "The Cities Act". Retrieved 2008-02-09.
- Saskatchewan Queen's Printer. "The Northern Saskatchewan Administration District Boundaries Regulations". Retrieved 2008-02-09.
- Saskatchewan Queen's Printer. "The Northern Municipalities Act". Retrieved 2008-02-09.
- "Population and dwelling counts, for Canada, provinces and territories, and census subdivisions (municipalities), 2011 and 2006 censuses (Saskatchewan)". Statistics Canada. May 28, 2012. Retrieved December 15, 2012.
- "Search for Municipal Information". Saskatchewan Ministry of Municipal Affairs. Archived from the original on March 10, 2014. Retrieved December 16, 2012.
- "Urban Municipality Incorporation Dates". Archived from the original on February 25, 2012. Retrieved February 12, 2010.
- "Population and dwelling counts, for Canada, provinces and territories, and census subdivisions (municipalities), 2016 and 2011 censuses – 100% data". Statistics Canada. February 8, 2018. Retrieved May 22, 2018.
- "Population and dwelling counts, for Canada, provinces and territories, and census subdivisions (municipalities), 2011 and 2006 censuses (Saskatchewan)". Statistics Canada. May 28, 2012. Retrieved December 16, 2012.
- "Corrections and updates: Population and dwelling count amendments, 2011 Census". Statistics Canada. August 13, 2013. Retrieved December 15, 2013.
- "Population and dwelling counts, for Canada, provinces and territories, and census subdivisions (municipalities), 2011 and 2006 censuses (Saskatchewan)". Statistics Canada. May 28, 2012. Retrieved December 15, 2012.
- "Urban Municipality Incorporations". Saskatchewan Ministry of Government Relations. Archived from the original on October 15, 2014. Retrieved June 7, 2020.
- "Search for Municipal Information". Saskatchewan Ministry of Municipal Affairs. Archived from the original on March 10, 2014. Retrieved December 16, 2012.
- "Population and dwelling counts, for Canada, provinces and territories, and census subdivisions (municipalities), 2016 and 2011 censuses – 100% data (Saskatchewan)". Statistics Canada. February 8, 2017. Retrieved June 7, 2020.
- "Search for Municipal Information". Saskatchewan Ministry of Municipal Affairs. Archived from the original on March 10, 2014. Retrieved December 16, 2012.
- "Population and dwelling counts, for Canada, provinces and territories, and census subdivisions (municipalities), 2011 and 2006 censuses (Saskatchewan)". Statistics Canada. May 28, 2012. Retrieved December 16, 2012.
- "Corrections and updates: Population and dwelling count amendments, 2011 Census". Statistics Canada. August 13, 2013. Retrieved December 15, 2013.
- "The Municipalities Act" (PDF). Government of Saskatchewan. Retrieved December 12, 2012.
- "Southern and Central Saskatchewan, Canada: Rural Municipalities". Saskatchewan Department of Government Relations and Aboriginal Affairs. 2002. Archived from the original on October 19, 2013. Retrieved December 12, 2012.
- "Search for Municipal Information". Saskatchewan Ministry of Municipal Relations. Archived from the original on March 10, 2014. Retrieved December 12, 2012.
- "Rural Municipality Incorporations (Alphabetical)". Saskatchewan Ministry of Municipal Affairs. Archived from the original on April 21, 2011. Retrieved June 29, 2014.CS1 maint: BOT: original-url status unknown (link)
- "Northern Communities Incorporation Dates" (PDF). Saskatchewan Ministry of Municipal Affairs. Archived from the original on December 20, 2013. Retrieved December 20, 2013.
- "Corrections and updates". Statistics Canada. August 13, 2013. Retrieved December 15, 2013.
- "Restructuring Comparison Chart – What to Expect" (PDF). Government of Saskatchewan: Ministry of Government Relations. April 2, 2013. Retrieved August 31, 2015.
- "Population and dwelling counts, for Canada, provinces and territories, and designated places, 2011 and 2006 censuses (Saskatchewan)". Statistics Canada. April 17, 2015. Retrieved August 31, 2015.
- "Census Profile: Stornoway (Dissolved census subdivision)". Statistics Canada. February 9, 2015. Retrieved August 31, 2015.
- "Organized Hamlet Guide, In Saskatchewan". https://www.saskatchewan.ca/. Government of Saskatchewan. Retrieved 9 July 2019. External link in
|website=(help) - "2019-2020 Rural Revenue Sharing Organized Hamlet Grant". Government of Saskatchewan. Retrieved May 8, 2020.
Other sources
- Barry, Bill (1998). People Places : The Dictionary of Saskatchewan Place Names. Regina, Saskatchewan: People Places Publishing Ltd. ISBN 978-1-894022-19-4.
| Provinces |
|
|---|---|
| Territories | |
| |