Virginia gubernatorial election, 1993
|
|
|
| Turnout |
61.1% (voting eligible)[1] |
|---|
|
|
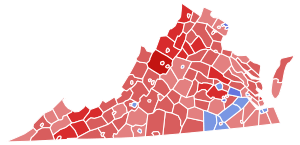 Virginia gubernatorial election results map. Red denotes counties or districts won by Allen. Blue denotes those won by Terry.
|
Allen
40–50%
50–60%
60–70%
70–80%
|
Terry
50–60%
60–70%
|
|
|
The Virginia gubernatorial election of 1993 was held on November 2, 1993. Barred from seeking a second term due to term limits restricting consecutive terms for Virginia Governor, incumbent Democratic Governor L. Douglas Wilder was replaced by Republican nominee and U.S. Representative George Allen. Allen defeated longtime Attorney General of Virginia Mary Sue Terry, the Democratic nominee by 58.3% to 40.9%, which ended 12 consecutive years of Democratic control of the Governor's Mansion.
General election
Results
| County |
Allen |
Votes |
Terry |
Votes |
Spannaus |
Votes |
| Augusta |
81.0% |
14,029 |
18.1% |
3,126 |
0.4% |
156 |
| Rockingham |
79.0% |
13,555 |
20.3% |
3,485 |
0.9% |
54 |
| Bland |
78.9% |
1,607 |
20.1% |
410 |
0.9% |
19 |
| Colonial Heights City |
76.9% |
5,007 |
22.4% |
1,459 |
0.7% |
46 |
| Greene |
76.3% |
2,592 |
22.9% |
779 |
0.8% |
28 |
| Shenandoah |
76.1% |
8,046 |
23.3% |
2,463 |
0.6% |
59 |
| Page |
75.5% |
4,690 |
23.9% |
1,485 |
0.5% |
32 |
| Frederick |
74.8% |
9,510 |
24.7% |
3,139 |
0.5% |
66 |
| Hanover |
74.2% |
19,817 |
25.2% |
6,728 |
0.6% |
153 |
| Culpeper |
73.1% |
5,750 |
26.2% |
2,063 |
0.6% |
50 |
| Staunton City |
72.5% |
5,263 |
26.6% |
1,932 |
0.8% |
57 |
| Powhatan |
71.9% |
3,904 |
27.4% |
1,485 |
0.7% |
38 |
| Smyth |
71.6% |
6,782 |
27.1% |
2,566 |
1.4% |
130 |
| Poqouson City |
71.2% |
2,931 |
28.1% |
1,158 |
0.7% |
28 |
| Madison |
71.0% |
2,763 |
28.2% |
1,098 |
0.8% |
30 |
| Chesterfield |
70.8% |
51,317 |
28.4% |
20,602 |
0.7% |
496 |
| Bristol City |
70.7% |
3,208 |
28.3% |
1,283 |
1.0% |
45 |
| Waynesboro City |
70.7% |
3,777 |
28.2% |
1,505 |
1.1% |
57 |
| Washington |
70.2% |
9,579 |
28.6% |
3,904 |
1.2% |
164 |
| Tazewell |
70.1% |
7,214 |
28.1% |
2,894 |
1.7% |
180 |
| Chesterfield |
70.8% |
51,317 |
28.4% |
20,602 |
0.7% |
496 |
| Scott |
69.9% |
5,421 |
28.8% |
2,234 |
1.3% |
97 |
| Warren |
69.5% |
4,767 |
30.0% |
2,059 |
0.5% |
31 |
| Wythe |
69.2% |
5,606 |
29.7% |
2,410 |
1.0% |
85 |
| Highland |
69.0% |
795 |
29.9% |
345 |
1.0% |
11 |
| Richmond |
68.8% |
1,615 |
30.5% |
1,615 |
0.7% |
16 |
| Fauquier |
68.3% |
9,923 |
31.3% |
4,545 |
0.4% |
62 |
| Harrisonburg City |
68.3% |
4,715 |
2,141% |
31.0 |
0.6% |
42 |
| Bedford |
68.1% |
10,637 |
31.2% |
4,874 |
0.7% |
112 |
| Campbell |
67.9% |
9,940 |
31.4% |
4,599 |
0.7% |
99 |
| Spotsylvania |
67.9% |
11,543 |
31.6% |
5,368 |
0.5% |
91 |
| Stafford |
67.9% |
11,631 |
31.4% |
5,382 |
0.7% |
125 |
| Fluvanna |
67.7% |
3,289 |
31.5% |
1,533 |
0.8% |
38 |
| Prince George |
67.7% |
4,671 |
31.6% |
2,179 |
0.8% |
53 |
| Carroll |
67.4% |
5,424 |
32.0% |
2,577 |
0.6% |
49 |
| Winchester City |
66.9% |
3,708 |
32.4% |
1,798 |
0.9% |
35 |
| Orange |
66.8% |
4,409 |
32.3% |
2,133 |
0.9% |
59 |
| Pittsylvania |
66.5% |
11,172 |
32.4% |
5,439 |
1.0% |
176 |