Montgomery County, Virginia
| Montgomery County, Virginia | ||
|---|---|---|
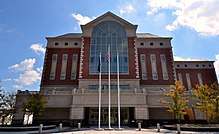 Montgomery County Courthouse | ||
| ||
| Motto: Freedom Increases Responsibility | ||
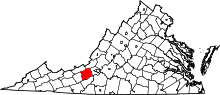 Location in the U.S. state of Virginia | ||
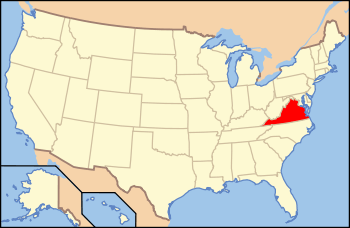 Virginia's location in the U.S. | ||
| Founded | 1772 | |
| Named for | Richard Montgomery | |
| Seat | Christiansburg | |
| Largest town | Blacksburg | |
| Area | ||
| • Total | 389 sq mi (1,008 km2) | |
| • Land | 387 sq mi (1,002 km2) | |
| • Water | 2.2 sq mi (6 km2), 0.6% | |
| Population (est.) | ||
| • (2015) | 97,653 | |
| • Density | 251/sq mi (97/km2) | |
| Congressional district | 9th | |
| Time zone | Eastern: UTC−5/−4 | |
| Website |
www | |

Montgomery County is a county located in the Valley and Ridge area of the U.S. state of Virginia. As population in the area increased, Montgomery County was formed in 1777 from Fincastle County, which in turn had been taken from Botetourt County. As of the 2010 census, the population was 94,392.[1] Its county seat is Christiansburg.[2]
Montgomery County is part of the Blacksburg–Christiansburg–Radford, VA Metropolitan Statistical Area. It is dominated economically by the presence of Virginia Tech, Virginia's third largest public university,[3] which is the county's largest employer.[4]
Board of Supervisors
| Person | District |
|---|---|
| Annette Perkins | A |
| Chris Tuck | B, Chair |
| Gary Creed | C |
| Todd King | D, |
| Darrell Sheppard | E |
| Mary Biggs | F |
| April DeMotts | G Vice chair |
History
Montgomery County was established in 1777 from Fincastle County. The county is named for Richard Montgomery, an American Revolutionary War general killed in 1775 while attempting to capture Quebec City, Canada.
Geography
According to the U.S. Census Bureau, the county has a total area of 389 square miles (1,010 km2), of which 387 square miles (1,000 km2) is land and 2.2 square miles (5.7 km2) (0.6%) is water.[5] The western part of the county is in the New River watershed.
Adjacent counties and city
- Craig County - Northeast
- Giles County - Northwest
- City of Radford - West
- Pulaski County - Southwest
- Floyd County - South
- Roanoke County - East
National protected area
- Jefferson National Forest (part)
Major highways
Demographics
| Historical population | |||
|---|---|---|---|
| Census | Pop. | %± | |
| 1790 | 13,228 | — | |
| 1800 | 9,044 | −31.6% | |
| 1810 | 8,409 | −7.0% | |
| 1820 | 8,733 | 3.9% | |
| 1830 | 12,306 | 40.9% | |
| 1840 | 7,405 | −39.8% | |
| 1850 | 8,359 | 12.9% | |
| 1860 | 10,617 | 27.0% | |
| 1870 | 12,556 | 18.3% | |
| 1880 | 16,693 | 32.9% | |
| 1890 | 17,742 | 6.3% | |
| 1900 | 15,852 | −10.7% | |
| 1910 | 17,268 | 8.9% | |
| 1920 | 18,595 | 7.7% | |
| 1930 | 19,605 | 5.4% | |
| 1940 | 21,206 | 8.2% | |
| 1950 | 29,780 | 40.4% | |
| 1960 | 32,923 | 10.6% | |
| 1970 | 47,157 | 43.2% | |
| 1980 | 63,516 | 34.7% | |
| 1990 | 73,913 | 16.4% | |
| 2000 | 83,629 | 13.1% | |
| 2010 | 94,392 | 12.9% | |
| Est. 2016 | 98,602 | [6] | 4.5% |
| U.S. Decennial Census[7] 1790-1960[8] 1900-1990[9] 1990-2000[10] 2010-2015[1] | |||
As of the 2010 United States Census, there were 94,392 people residing in the county. 87.6% were White, 5.4% Asian, 3.9% Black or African American, 0.2% Native American, 0.8% of some other race and 2.1% of two or more races. 2.7% were Hispanic or Latino (of any race).
As of the census[11] of 2000, there were 83,629 people, 30,997 households, and 17,203 families residing in the county. The population density was 215 people per square mile (83/km²). There were 32,527 housing units at an average density of 84 per square mile (32/km²). The racial makeup of the county was 90.00% White, 3.65% Black or African American, 0.18% Native American, 3.97% Asian, 0.04% Pacific Islander, 0.63% from other races, and 1.53% from two or more races. 1.58% of the population were Hispanic or Latino of any race.
There were 30,997 households out of which 25.30% had children under the age of 18 living with them, 44.80% were married couples living together, 7.60% had a female householder with no husband present, and 44.50% were non-families. 25.50% of all households were made up of individuals and 6.60% had someone living alone who was 65 years of age or older. The average household size was 2.40 and the average family size was 2.87.
In the county, the population was spread out with 17.10% under the age of 18, 31.30% from 18 to 24, 25.60% from 25 to 44, 17.30% from 45 to 64, and 8.60% who were 65 years of age or older. The median age was 26 years. For every 100 females, there were 110.00 males. For every 100 females age 18 and over, there were 110.90 males.
The median income for a household in the county was $32,330, and the median income for a family was $47,239. Males had a median income of $33,674 versus $23,555 for females. The per capita income for the county was $17,077. About 8.80% of families and 23.20% of the population were below the poverty line, including 14.60% of those under age 18 and 8.80% of those age 65 or over.
Politics
| Year | Republican | Democratic | Third parties |
|---|---|---|---|
| 2016 | 45.2% 19,459 | 46.5% 20,021 | 8.3% 3,551 |
| 2012 | 48.8% 20,006 | 48.5% 19,903 | 2.7% 1,100 |
| 2008 | 46.8% 19,028 | 51.7% 21,031 | 1.5% 594 |
| 2004 | 54.2% 17,070 | 44.8% 14,128 | 1.0% 317 |
| 2000 | 51.5% 13,991 | 43.2% 11,720 | 5.3% 1,449 |
| 1996 | 43.3% 10,517 | 44.7% 10,867 | 12.0% 2,914 |
| 1992 | 42.5% 10,606 | 42.7% 10,658 | 14.7% 3,671 |
| 1988 | 57.5% 12,326 | 41.6% 8,909 | 1.0% 209 |
| 1984 | 62.9% 12,428 | 36.4% 7,202 | 0.7% 135 |
| 1980 | 47.4% 8,222 | 43.0% 7,455 | 9.6% 1,667 |
| 1976 | 50.6% 7,971 | 47.9% 7,539 | 1.5% 232 |
| 1972 | 70.6% 9,348 | 27.9% 3,692 | 1.6% 208 |
| 1968 | 61.5% 7,098 | 23.4% 2,700 | 15.2% 1,749 |
| 1964 | 54.2% 4,604 | 45.6% 3,872 | 0.2% 13 |
| 1960 | 66.3% 4,270 | 33.5% 2,157 | 0.3% 18 |
| 1956 | 70.1% 4,598 | 28.2% 1,848 | 1.7% 113 |
| 1952 | 70.7% 3,881 | 29.1% 1,600 | 0.2% 10 |
| 1948 | 59.6% 2,070 | 32.4% 1,126 | 8.0% 277 |
| 1944 | 53.7% 1,936 | 45.8% 1,652 | 0.5% 19 |
| 1940 | 46.4% 1,890 | 53.2% 2,168 | 0.4% 17 |
| 1936 | 49.9% 1,852 | 49.3% 1,832 | 0.8% 29 |
| 1932 | 44.7% 1,522 | 53.0% 1,805 | 2.3% 78 |
| 1928 | 65.8% 1,861 | 34.2% 967 | |
| 1924 | 44.4% 964 | 52.7% 1,142 | 2.9% 63 |
| 1920 | 53.8% 1,160 | 44.9% 969 | 1.3% 28 |
| 1916 | 53.5% 891 | 45.9% 765 | 0.7% 11 |
| 1912 | 21.9% 349 | 42.9% 684 | 35.3% 563 |
Education
Colleges and universities
Public High schools
Private High schools
- Pathway Christian Academy
- Dayspring Christian Academy
Communities
Towns
Census-designated places
Other unincorporated communities
- Alleghany Springs
- Bradshaw
- Belmont
- Childress
- Ellett
- Graysontown
- Ironto
- Long Shop
- Lusters Gate
- McCoy
- McDonalds Mill
- Pilot
- Rogers
- Sowers
- Sugar Grove
- Toms Creek
- Vicker
- Walton
- Yellow Sulphur Springs
See also
References
- 1 2 "State & County QuickFacts". United States Census Bureau. Archived from the original on July 15, 2011. Retrieved January 3, 2014.
- ↑ "Find a County". National Association of Counties. Retrieved 2011-06-07.
- ↑ "Rankings | Largest U.S. colleges - Universities with the highest enrollment | State | Virginia (VA)". www.collegeraptor.com. Retrieved 2018-09-05.
- ↑ Virginia Employment Commission (August 30, 2018). "Virginia Community Profile: Montgomery County" (PDF). Virginia Labor Market Information.
- ↑ "US Gazetteer files: 2010, 2000, and 1990". United States Census Bureau. 2011-02-12. Retrieved 2011-04-23.
- ↑ "Population and Housing Unit Estimates". Retrieved June 9, 2017.
- ↑ "U.S. Decennial Census". United States Census Bureau. Retrieved January 3, 2014.
- ↑ "Historical Census Browser". University of Virginia Library. Retrieved January 3, 2014.
- ↑ "Population of Counties by Decennial Census: 1900 to 1990". United States Census Bureau. Retrieved January 3, 2014.
- ↑ "Census 2000 PHC-T-4. Ranking Tables for Counties: 1990 and 2000" (PDF). United States Census Bureau. Retrieved January 3, 2014.
- ↑ "American FactFinder". United States Census Bureau. Retrieved 2011-05-14.
- ↑ Leip, David. "Dave Leip's Atlas of U.S. Presidential Elections". uselectionatlas.org. Retrieved 3 April 2018.
Places adjacent to Montgomery County, Virginia | ||||||||||
|---|---|---|---|---|---|---|---|---|---|---|
| ||||||||||
Municipalities and communities of Montgomery County, Virginia, United States | ||
|---|---|---|
| Towns | | |
| CDPs | ||
| Unincorporated communities | ||
| Footnotes | ‡This populated place also has portions in an adjacent county or counties | |