United States presidential election in Virginia, 2008
|
| ||||||||||||||||||||||||||
| ||||||||||||||||||||||||||
| Turnout | 74.0% (of registered voters)[1] | |||||||||||||||||||||||||
|---|---|---|---|---|---|---|---|---|---|---|---|---|---|---|---|---|---|---|---|---|---|---|---|---|---|---|
| ||||||||||||||||||||||||||
 County Results
| ||||||||||||||||||||||||||
| ||||||||||||||||||||||||||
The 2008 United States presidential election in Virginia took place on November 4, 2008, which was part of the 2008 United States presidential election. Voters chose 13 representatives, or electors to the Electoral College, who voted for president and vice president.
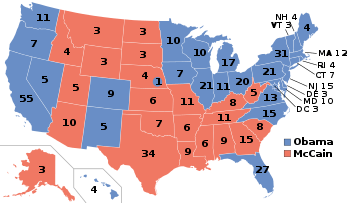
Virginia was won by Democratic nominee Barack Obama by a 6.3% margin of victory. Prior to the election, all 17 news organizations considered this a state Obama would win, or otherwise considered as a blue state, despite the fact that initially Virginia was a swing state that both campaigns targeted heavily in 2008 and that Virginia had been one of the most reliable red states in the nation since 1952. The financial meltdown, the changing demographics, and the population increases in voter rich Northern Virginia gave Obama the edge as he was projected the winner in the Old Dominion State. It was the first time in over 40 years that Virginia voted for a Democratic presidential nominee since Lyndon B. Johnson's victory in 1964.
This also marked the first presidential election since 1924 in which Virginia voted for the Democratic presidential candidate whilst neighbouring West Virginia voted for the Republican presidential candidate.
Primaries
Campaign
| Elections in Virginia | ||||||||||||
|---|---|---|---|---|---|---|---|---|---|---|---|---|
 | ||||||||||||
|
||||||||||||
Virginia was one of the first Southern states to break away from its traditional Democratic roots. It voted for Dwight Eisenhower by a convincing margin in 1952, and had voted for every Republican nominee since then save for Johnson's massive landslide in 1964.
However, the Democrats have made strong gains in the past years with winning two gubernatorial races in a row, regaining control of the Virginia Senate, and electing Democrat Jim Webb to the U.S. Senate in the Democratic wave of the 2006 midterms over incumbent Republican George Allen. Democrats have been able to make such gains in Virginia due in large part to the ever-expanding Northern Virginia, particularly the suburbs surrounding Washington, D.C. Historically, this area had been strongly Republican. However, in recent years it has been dominated by white liberals who tend to vote Democratic.[2] It was, ultimately, this rapid demographic change that provided a huge new influx of Democratic voters to Virginia.[3]
Both presidential campaigns and the mainstream media treated Virginia as a swing state for most of the campaign. Obama campaigned extensively in Virginia and counted on the booming northern parts of the state for a Democratic victory. Victory for McCain would have been extremely difficult without Virginia; he would have had to win every swing state as well as at least one Democratic-leaning state.
Predictions
There were 17 news organizations who made state-by-state predictions of the election. Here are their last predictions before election day:
- D.C. Political Report: Democrat[4]
- Cook Political Report: Leaning Democrat[5]
- Takeaway: Leaning Obama[6]
- Election Projection: Leaning Obama[7]
- Electoral-vote.com: Leaning Democrat[8]
- Washington Post: Leaning Obama[9]
- Politico: Leaning Obama[10]
- Real Clear Politics: Leaning Obama[11]
- FiveThirtyEight.com: Leaning Obama[9]
- CQ Politics: Leaning Democrat[12]
- New York Times: Leaning Democrat[13]
- CNN: Leaning Democrat[14]
- NPR: Leaning Obama[9]
- MSNBC: Leaning Obama[9]
- Fox News: Democrat[15]
- Associated Press: Democrat[16]
- Rasmussen Reports: Leaning Democrat[17]
Polling
After McCain clinched the Republican Party nomination in early March, he took a wide lead in polls against Obama, averaging almost 50%. But through the summer, polling was dead even. After the Lehman Brothers went bankrupt, Obama took a wide lead in the polls. In October, Obama won every single poll taken, and reached over 50% in most of them. The final three polls averaged Obama leading 52% to 46%.[18][19]
Fundraising
Obama raised $17,035,784. McCain raised $16,130,194.[20]
Spending and visits
Obama spent over $26 million to McCain spending just $14 million.[21] The Obama-Biden ticket visited the state 19 times compared to just 10 times for McCain-Palin.[22]
Analysis
.jpg)
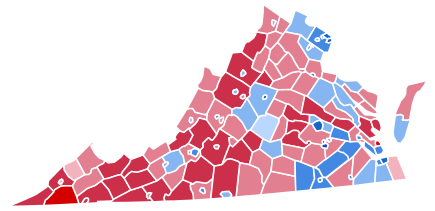
On Election Day, early returns showed McCain ahead.[23] This was due in large part to the fact that many of the rural areas began to report first. However, Obama swamped McCain by scoring a near-sweep in Northern Virginia, which reported its returns last.
Obama did extremely well throughout the most populous regions of the state. Northern Virginia overwhelmingly supported Obama.[24] Fairfax County and Arlington counties, traditionally the most Democratic counties in the region, gave Obama over 60% of the vote. Moreover, Loudoun and Prince William counties, normally the more conservative counties in the region, voted Democratic for the first time since LBJ's 1964 landslide.
The two other major metropolitan areas in the eastern part of the state, Richmond and Hampton Roads, are somewhat less Democratic than Northern Virginia. In both areas, Obama improved significantly on John Kerry's performance.[24] While Obama easily won Richmond itself (which is 57% African American), he also made significant inroads into Richmond's traditionally heavily Republican suburbs. He carried Henrico County with 57 percent of the vote; that county last supported a Democrat with Harry S. Truman in 1948.[25] In Chesterfield County, Obama did almost 20 points better than Kerry.[26] Both counties have historically been strongly Republican, although Henrico is something of a swing county at state-level elections.
Obama also did very well in Hampton Roads. The four Democratic-leaning cities along the harbor - Hampton, Newport News, Norfolk, and Portsmouth - gave him margins exceeding 60%. Obama also split the Republican-leaning cities of Chesapeake and Virginia Beach; he barely won the former and barely lost the latter. Obama's strong performance in the area likely contributed to Democrat Glenn Nye unseating two-term Republican incumbent Thelma Drake in the 2nd Congressional District, a heavy military district which includes all of Virginia Beach and large portions of Norfolk and Hampton.
Obama also significantly outperformed Kerry in Western Virginia, an area where the national Democratic Party has historically not done well. Danville and Roanoke, usually the most Democratic cities in this region, gave him moderate support. He also had a major breakthrough in the Shenandoah Valley, historically one of the most Republican areas of the state. He won Harrisonburg, the largest city in the region, with a resounding 57 percent of the vote. He also won the second-largest city in the area, Staunton, albeit more narrowly. The Shenandoah Valley had been among the first regions of the state to turn Republican. The old Byrd Democrats in this region started splitting their tickets as early as the 1930s, and some counties in this region haven't supported a Democrat since Franklin D. Roosevelt. Several rural counties in Eastern Virginia with high African-American populations voted for Obama as well.
In contrast to Obama, McCain did well throughout rural Virginia.[26] He won the vast majority of its counties. In the part of Virginia protruding out west, Obama ran roughly even with Kerry, even though he comfortably won the election and Kerry lost. This area, save for one county and a few small towns, uniformly supported McCain. In addition, a number of unionized, Appalachian counties located next to Kentucky voted Republican; they had cast strong ballots for Bill Clinton. This was not surprising as this part of Virginia is a part of Appalachia, a region in which Obama consistently struggled during the course of the Democratic primary.
The Republican base in Virginia consists of the state's traditional Republican heartland in the Blue Ridge Mountains, social conservatives in the Shenandoah Valley and suburbanites in the east.[27] McCain closely matched George W. Bush's numbers among the first group and only did slightly worse than Bush amongst the second group. However, in 2008, suburbanites in Northern Virginia and in the Richmond/Hampton Roads areas abandoned the Republican Party in droves, and it was simply impossible for McCain to win the state without their support.
During the same election, former Democratic Governor Mark Warner solidly defeated former Governor (and his predecessor) Republican Jim Gilmore by a two-to-one margin for the open U.S. Senate seat vacated by incumbent Republican John Warner (no relation to Mark Warner). Warner received 65.03% of the vote while Gilmore took in 33.73%. Warner won all but five counties in the state. Democrats also picked up three seats in the U.S. House of Representatives. At the state level, Democrats picked up one seat in the Virginia House of Delegates.
Despite Obama's victory, the fact remains that Virginia's margin was 0.97% more Republican than the national average. As of the 2016 presidential election, this is the last election in which King and Queen County, Virginia voted for the Democratic candidate.
Results
| United States presidential election in Virginia, 2008[28] | ||||||
|---|---|---|---|---|---|---|
| Party | Candidate | Running mate | Votes | Percentage | Electoral votes | |
| Democratic | Barack Obama | Joe Biden | 1,959,532 | 52.63% | 13 | |
| Republican | John McCain | Sarah Palin | 1,725,005 | 46.33% | 0 | |
| Independent | Ralph Nader | Matt Gonzalez | 11,483 | 0.31% | 0 | |
| Libertarian | Bob Barr | Wayne Allyn Root | 11,067 | 0.30% | 0 | |
| Constitution | Chuck Baldwin | Darrell Castle | 7,474 | 0.20% | 0 | |
| Green | Cynthia McKinney | Rosa Clemente | 2,344 | 0.06% | 0 | |
| Write-ins | Write-ins | 6,355 | 0.17% | 0 | ||
| Totals | 3,723,260 | 100.00% | 13 | |||
| Voter turnout (Voting age population) | 65.1% | |||||
Results breakdown
By county/city
| County/City | Obama% | Obama# | McCain% | McCain# | Total |
|---|---|---|---|---|---|
| Accomack County | 49.27% | 7,607 | 50.73% | 7,833 | 15,440 |
| Albemarle County | 59.15% | 29,792 | 40.85% | 20,576 | 50,368 |
| Alleghany County | 48.89% | 3,553 | 51.11% | 3,715 | 7,268 |
| Amelia County | 38.53% | 2,488 | 61.47% | 3,970 | 6,458 |
| Amherst County | 41.84% | 6,094 | 58.16% | 8,470 | 14,564 |
| Appomattox County | 35.01% | 2,641 | 64.99% | 4,903 | 7,544 |
| Arlington County | 72.56% | 78,994 | 27.44% | 29,876 | 108,870 |
| Augusta County | 29.82% | 9,825 | 70.18% | 23,120 | 32,945 |
| Bath County | 43.60% | 1,043 | 56.40% | 1,349 | 2,392 |
| Bedford County | 31.09% | 11,017 | 68.91% | 24,420 | 35,437 |
| Bland County | 29.84% | 864 | 70.16% | 2,031 | 2,895 |
| Botetourt County | 33.17% | 5,693 | 66.83% | 11,471 | 17,164 |
| Brunswick County | 63.35% | 4,973 | 36.65% | 2,877 | 7,850 |
| Buchanan County | 47.22% | 4,063 | 52.78% | 4,541 | 8,604 |
| Buckingham County | 50.44% | 3,489 | 49.56% | 3,428 | 6,917 |
| Campbell County | 31.69% | 8,091 | 68.31% | 17,444 | 25,535 |
| Caroline County | 56.05% | 7,163 | 43.95% | 5,617 | 12,780 |
| Carroll County | 33.41% | 4,108 | 66.59% | 8,187 | 12,295 |
| Charles City County | 68.78% | 2,838 | 31.22% | 1,288 | 4,126 |
| Charlotte County | 44.51% | 2,705 | 55.49% | 3,372 | 6,077 |
| Chesterfield County | 46.23% | 74,310 | 53.77% | 86,413 | 160,723 |
| Clarke County | 47.38% | 3,457 | 52.62% | 3,840 | 7,297 |
| Craig County | 34.07% | 876 | 65.93% | 1,695 | 2,571 |
| Culpeper County | 45.11% | 8,802 | 54.89% | 10,711 | 19,513 |
| Cumberland County | 48.26% | 2,255 | 51.74% | 2,418 | 4,673 |
| Dickenson County | 49.65% | 3,278 | 50.35% | 3,324 | 6,602 |
| Dinwiddie County | 48.90% | 6,246 | 51.10% | 6,526 | 12,772 |
| Essex County | 55.22% | 2,934 | 44.78% | 2,379 | 5,313 |
| Fairfax County | 60.69% | 310,359 | 39.31% | 200,994 | 511,353 |
| Fauquier County | 43.19% | 14,616 | 56.81% | 19,227 | 33,843 |
| Floyd County | 39.81% | 2,937 | 60.19% | 4,441 | 7,378 |
| Fluvanna County | 49.07% | 6,185 | 50.93% | 6,420 | 12,605 |
| Franklin County | 38.42% | 9,618 | 61.58% | 15,414 | 25,032 |
| Frederick County | 39.15% | 12,961 | 60.85% | 20,149 | 33,110 |
| Giles County | 41.70% | 3,192 | 58.30% | 4,462 | 7,654 |
| Gloucester County | 36.39% | 6,916 | 63.61% | 12,089 | 19,005 |
| Goochland County | 38.64% | 4,813 | 61.36% | 7,643 | 12,456 |
| Grayson County | 35.33% | 2,480 | 64.67% | 4,540 | 7,020 |
| Greene County | 38.93% | 3,174 | 61.07% | 4,980 | 8,154 |
| Greensville County | 64.36% | 3,122 | 35.64% | 1,729 | 4,851 |
| Halifax County | 48.58% | 8,126 | 51.42% | 8,600 | 16,726 |
| Hanover County | 33.06% | 18,447 | 66.94% | 37,344 | 55,791 |
| Henrico County | 56.16% | 86,323 | 43.84% | 67,381 | 153,704 |
| Henry County | 44.69% | 11,118 | 55.31% | 13,758 | 24,876 |
| Highland County | 38.82% | 590 | 61.18% | 930 | 1,520 |
| Isle of Wight County | 43.23% | 8,573 | 56.77% | 11,258 | 19,831 |
| James City County | 45.35% | 17,352 | 54.65% | 20,912 | 38,264 |
| King and Queen County | 52.11% | 1,918 | 47.89% | 1,763 | 3,681 |
| King George County | 43.17% | 4,473 | 56.83% | 5,888 | 10,361 |
| King William County | 40.24% | 3,344 | 59.76% | 4,966 | 8,310 |
| Lancaster County | 47.01% | 3,235 | 52.99% | 3,647 | 6,882 |
| Lee County | 35.59% | 3,219 | 64.41% | 5,825 | 9,044 |
| Loudoun County | 54.16% | 74,845 | 45.84% | 63,336 | 138,181 |
| Louisa County | 46.03% | 6,978 | 53.97% | 8,182 | 15,160 |
| Lunenburg County | 48.24% | 2,703 | 51.76% | 2,900 | 5,603 |
| Madison County | 43.23% | 2,862 | 56.77% | 3,758 | 6,620 |
| Mathews County | 35.99% | 1,943 | 64.01% | 3,456 | 5,399 |
| Mecklenburg County | 47.69% | 7,127 | 52.31% | 7,817 | 14,944 |
| Middlesex County | 40.28% | 2,391 | 59.72% | 3,545 | 5,936 |
| Montgomery County | 52.50% | 21,031 | 47.50% | 19,028 | 40,059 |
| Nelson County | 54.63% | 4,391 | 45.37% | 3,647 | 8,038 |
| New Kent County | 35.36% | 3,493 | 64.64% | 6,385 | 9,878 |
| Northampton County | 58.34% | 3,800 | 41.66% | 2,713 | 6,513 |
| Northumberland County | 45.04% | 3,312 | 54.96% | 4,041 | 7,353 |
| Nottoway County | 49.38% | 3,413 | 50.62% | 3,499 | 6,912 |
| Orange County | 45.52% | 7,107 | 54.48% | 8,506 | 15,613 |
| Page County | 41.21% | 4,235 | 58.79% | 6,041 | 10,276 |
| Patrick County | 34.40% | 2,879 | 65.60% | 5,491 | 8,370 |
| Pittsylvania County | 37.87% | 11,415 | 62.13% | 18,730 | 30,145 |
| Powhatan County | 29.58% | 4,237 | 70.42% | 10,088 | 14,325 |
| Prince Edward County | 55.00% | 5,101 | 45.00% | 4,174 | 9,275 |
| Prince George County | 44.89% | 7,130 | 55.11% | 8,752 | 15,882 |
| Prince William County | 58.01% | 93,435 | 41.99% | 67,621 | 161,056 |
| Pulaski County | 40.05% | 5,918 | 59.95% | 8,857 | 14,775 |
| Rappahannock County | 48.59% | 2,105 | 51.41% | 2,227 | 4,332 |
| Richmond County | 43.61% | 1,618 | 56.39% | 2,092 | 3,710 |
| Roanoke County | 39.32% | 19,812 | 60.68% | 30,571 | 50,383 |
| Rockbridge County | 43.13% | 4,347 | 56.87% | 5,732 | 10,079 |
| Rockingham County | 31.75% | 10,453 | 68.25% | 22,468 | 32,921 |
| Russell County | 43.56% | 4,931 | 56.44% | 6,389 | 11,320 |
| Scott County | 28.08% | 2,725 | 71.92% | 6,980 | 9,705 |
| Shenandoah County | 36.54% | 6,912 | 63.46% | 12,005 | 18,917 |
| Smyth County | 35.16% | 4,239 | 64.84% | 7,817 | 12,056 |
| Southampton County | 48.99% | 4,402 | 51.01% | 4,583 | 8,985 |
| Spotsylvania County | 46.53% | 24,897 | 53.47% | 28,610 | 53,507 |
| Stafford County | 46.81% | 25,716 | 53.19% | 29,221 | 54,937 |
| Surry County | 61.23% | 2,626 | 38.77% | 1,663 | 4,289 |
| Sussex County | 61.97% | 3,301 | 38.03% | 2,026 | 5,327 |
| Tazewell County | 33.32% | 5,596 | 66.68% | 11,201 | 16,797 |
| Warren County | 44.07% | 6,997 | 55.93% | 8,879 | 15,876 |
| Washington County | 33.40% | 8,063 | 66.60% | 16,077 | 24,140 |
| Westmoreland County | 55.17% | 4,577 | 44.83% | 3,719 | 8,296 |
| Wise County | 35.91% | 4,995 | 64.09% | 8,914 | 13,909 |
| Wythe County | 33.35% | 4,107 | 66.65% | 8,207 | 12,314 |
| York County | 40.86% | 13,700 | 59.14% | 19,833 | 33,533 |
| Alexandria | 72.46% | 50,473 | 27.54% | 19,181 | 69,654 |
| Bedford | 44.66% | 1,208 | 55.34% | 1,497 | 2,705 |
| Bristol | 36.79% | 2,665 | 63.21% | 4,579 | 7,244 |
| Buena Vista | 46.36% | 1,108 | 53.64% | 1,282 | 2,390 |
| Charlottesville | 79.39% | 15,705 | 20.61% | 4,078 | 19,783 |
| Chesapeake | 50.64% | 53,994 | 49.36% | 52,625 | 106,619 |
| Colonial Heights | 29.37% | 2,562 | 70.63% | 6,161 | 8,723 |
| Covington | 56.11% | 1,304 | 43.89% | 1,020 | 2,324 |
| Danville | 59.63% | 12,352 | 40.37% | 8,361 | 20,713 |
| Emporia | 65.49% | 1,702 | 34.51% | 897 | 2,599 |
| Fairfax | 58.36% | 6,575 | 41.64% | 4,691 | 11,266 |
| Falls Church | 70.44% | 4,695 | 29.56% | 1,970 | 6,665 |
| Franklin | 64.14% | 2,819 | 35.86% | 1,576 | 4,395 |
| Fredericksburg | 64.33% | 6,155 | 35.67% | 3,413 | 9,568 |
| Galax | 44.41% | 1,052 | 55.59% | 1,317 | 2,369 |
| Hampton | 69.62% | 46,917 | 30.38% | 20,476 | 67,393 |
| Harrisonburg | 58.27% | 8,444 | 41.73% | 6,048 | 14,492 |
| Hopewell | 56.02% | 5,285 | 43.98% | 4,149 | 9,434 |
| Lexington | 62.80% | 1,543 | 37.20% | 914 | 2,457 |
| Lynchburg | 47.98% | 16,269 | 52.02% | 17,638 | 33,907 |
| Manassas | 55.72% | 7,518 | 44.28% | 5,975 | 13,493 |
| Manassas Park | 60.12% | 2,463 | 39.88% | 1,634 | 4,097 |
| Martinsville | 64.17% | 4,139 | 35.83% | 2,311 | 6,450 |
| Newport News | 64.45% | 51,972 | 35.55% | 28,667 | 80,639 |
| Norfolk | 71.68% | 62,819 | 28.32% | 24,814 | 87,633 |
| Norton | 49.97% | 743 | 50.03% | 744 | 1,487 |
| Petersburg | 89.69% | 13,774 | 10.31% | 1,583 | 15,357 |
| Poquoson | 25.05% | 1,748 | 74.95% | 5,229 | 6,977 |
| Portsmouth | 69.80% | 32,327 | 30.20% | 13,984 | 46,311 |
| Radford | 54.79% | 2,930 | 45.21% | 2,418 | 5,348 |
| Richmond | 79.79% | 73,623 | 20.21% | 18,649 | 92,272 |
| Roanoke | 61.83% | 24,934 | 38.17% | 15,394 | 40,328 |
| Salem | 42.15% | 5,164 | 57.85% | 7,088 | 12,252 |
| Staunton | 51.10% | 5,569 | 48.90% | 5,330 | 10,899 |
| Suffolk | 56.67% | 22,446 | 43.33% | 17,165 | 39,611 |
| Virginia Beach | 49.64% | 98,885 | 50.36% | 100,319 | 199,204 |
| Waynesboro | 44.79% | 3,906 | 55.21% | 4,815 | 8,721 |
| Williamsburg | 64.78% | 4,328 | 35.22% | 2,353 | 6,681 |
| Winchester | 52.72% | 5,268 | 47.28% | 4,725 | 9,993 |
By congressional district
Barack Obama carried six of the state’s 11 congressional districts, including four districts held by Republicans at the time of the election. John McCain carried five districts, one of which was held by Democrats on election day.
| District | McCain | Obama | Representative |
|---|---|---|---|
| 1st | 51.35% | 47.67% | Jo Ann Davis (110th Congress) |
| Robert J. Wittman (111th Congress) | |||
| 2nd | 48.48% | 50.45% | Thelma Drake (110th Congress) |
| Glenn Nye (111th Congress) | |||
| 3rd | 23.74% | 75.52% | Robert C. Scott |
| 4th | 48.80% | 50.33% | Randy Forbes |
| 5th | 50.59% | 48.29% | Virgil Goode (110th Congress) |
| Tom Perriello (111th Congress) | |||
| 6th | 56.93% | 41.85% | Bob Goodlatte |
| 7th | 53.16% | 45.89% | Eric Cantor |
| 8th | 29.65% | 69.28% | Jim Moran |
| 9th | 58.71% | 39.60% | Rick Boucher |
| 10th | 46.06% | 52.90% | Frank Wolf |
| 11th | 42.06% | 57.01% | Thomas M. Davis (110th Congress) |
| Gerry Connolly (111th Congress) |
Electors
Technically the voters of Virginia cast their ballots for electors: representatives to the Electoral College. Virginia is allocated 13 electors because it has 11 congressional districts and 2 senators. All candidates who appear on the ballot or qualify to receive write-in votes must submit a list of 13 electors, who pledge to vote for their candidate and his or her running mate. Whoever wins the majority of votes in the state is awarded all 13 electoral votes. Their chosen electors then vote for president and vice president. Although electors are pledged to their candidate and running mate, they are not obligated to vote for them.[29] An elector who votes for someone other than his or her candidate is known as a faithless elector.
The electors of each state and the District of Columbia met on December 15, 2008, to cast their votes for president and vice president. The Electoral College itself never meets as one body. Instead the electors from each state and the District of Columbia met in their respective capitols.
The following were the members of the Electoral College from the state. All 13 were pledged to Barack Obama and Joe Biden:[30]
- Christia Rey
- Sandra Brandt
- Betty Squire
- Susan Johnston Rowland
- Marc Finney
- Dorothy Blackwell
- James Harold Allen Boyd
- Marian Van Landingham
- Robert Edgar Childress
- Rolland Winter
- Janet Carver
- Michael Jon
- Sophie Ann Salley
References
- ↑ "Registration/Turnout Statistics". Virginia Department of Elections.
- ↑ "Back to the Future - The American Prospect". archive.org. 12 July 2007.
- ↑ Continetti, Matthew (October 2, 2006). "George Allen Monkeys Around". The Weekly Standard. 12 (03). Retrieved 2009-05-31.
- ↑ "D.C.'s Political Report: The complete source for campaign summaries". www.dcpoliticalreport.com.
- ↑ "Archived copy". Archived from the original on May 5, 2015. Retrieved May 4, 2015.
- ↑ Adnaan (2008-09-20). "Track the Electoral College vote predictions". The Takeaway. Archived from the original on April 22, 2009. Retrieved 2009-11-14.
- ↑ "Election Projection: 2008 Elections - Polls, Projections, Results". www.electionprojection.com.
- ↑ "Electoral-vote.com: President, Senate, House Updated Daily". electoral-vote.com.
- 1 2 3 4 Based on Takeaway
- ↑ "POLITICO's 2008 Swing State Map - POLITICO.com". www.politico.com.
- ↑ http://www.realclearpolitics.com/epolls/maps/obama_vs_mccain/?map=5
- ↑ "Archived copy". Archived from the original on June 14, 2009. Retrieved December 20, 2009.
- ↑ "The Electoral Map: Key States". The New York Times. Retrieved 2010-05-26.
- ↑ "October – 2008 – CNN Political Ticker - CNN.com Blogs". CNN. 2008-10-31. Retrieved 2010-05-26.
- ↑ "Winning The Electoral College". Fox News. 2010-04-27.
- ↑ "Associated Press News". AP News.
- ↑ Reports, Rasmussen. "Election 2008: Electoral College Update - Rasmussen Reports®". www.rasmussenreports.com.
- ↑ "2008 - Virginia: McCain vs. Obama - RealClearPolitics". www.realclearpolitics.com.
- ↑ http://uselectionatlas.org/POLLS/PRESIDENT/2008/pollsa.php?fips=51
- ↑ http://www.fec.gov/DisclosureSearch/MapAppState.do?stateName=VA&cand_id=P00000001
- ↑ "Map: Campaign Ad Spending - Election Center 2008 from CNN.com". CNN. Retrieved 2010-05-26.
- ↑ "Map: Campaign Candidate Visits - Election Center 2008 from CNN.com". CNN. Retrieved 2010-05-26.
- ↑ "Election 2008: Time lapse of U.S. counties". USA Today. 4 July 2008. Retrieved 2009-05-31.
- 1 2 Leip, David. "2008 Presidential General Election Results". David Leip's Atlas of U.S. Presidential Elections. Retrieved 2009-05-31.
- ↑ Todd, Chuck and Gawiser, Sheldon. How Barack Obama Won. New York City: Vintage, 2009.
- 1 2 "Election Results 2008". New York Times. Archived from the original on November 3, 2004. Retrieved 2009-05-31.
- ↑ Trende, Sean (19 February 2009). "Virginia Governor's Preview". RealClearPolitics. Retrieved 2009-05-31.
The question in Virginia is always whether the Republican Party can hold together its somewhat unwieldy three-legged coalition of historically Republican Virginians in the mountainous Appalachian western portion of the state, social conservatives in the rural areas east of the Blue Ridge Mountains, and suburbanites in Northern Virginia and in the Richmond/Hampton Roads areas. Why this coalition is having troubles recently could fill a book. For our purposes, we will oversimplify somewhat and observe the following.
- ↑ http://clerk.house.gov/member_info/electionInfo/2008election.pdf
- ↑ "Electoral College". California Secretary of State. Archived from the original on October 30, 2008. Retrieved 2008-11-01.
- ↑ "Archived copy" (PDF). Archived from the original (PDF) on June 4, 2011. Retrieved March 18, 2011.