Shenandoah County, Virginia
| Shenandoah County, Virginia | ||
|---|---|---|
 Shenandoah County Courthouse in Woodstock | ||
| ||
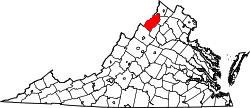 Location in the U.S. state of Virginia | ||
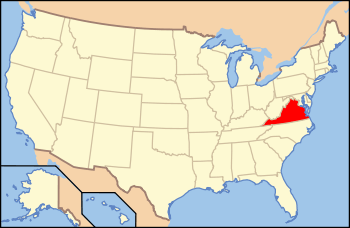 Virginia's location in the U.S. | ||
| Founded | 1772 | |
| Named for | Senedos Indian tribe | |
| Seat | Woodstock | |
| Largest town | Strasburg | |
| Area | ||
| • Total | 512 sq mi (1,326 km2) | |
| • Land | 509 sq mi (1,318 km2) | |
| • Water | 3.4 sq mi (9 km2), 0.7% | |
| Population (est.) | ||
| • (2015) | 43,190 | |
| • Density | 84/sq mi (32/km2) | |
| Congressional district | 6th | |
| Time zone | Eastern: UTC−5/−4 | |
| Website |
www | |

Shenandoah County (formerly Dunmore County) is a county located in the Commonwealth of Virginia. As of the 2010 census, the population was 41,993.[1] Its county seat is Woodstock.[2] It is part of the Shenandoah Valley region of Virginia.
History
The Senedos, possibly an Iroquoian group, are thought to have occupied the area at one time, until they were said to have been slaughtered by the Catawba in the later 17th century. The name of both the Valley and of the County is most likely connected with this Native American group. It has also been attributed to General George Washington naming it in honor of John Skenandoa, an Oneida chief from New York who helped gain support of Oneida and Tuscarora warriors to aid the rebel colonists during the American Revolutionary War.
Colonial Governor Gooch formally purchased the entire Shenandoah Valley from the Six Nations of the Iroquois by the Treaty of Lancaster in 1744. The Iroquois controlled the valley as a hunting ground. European settlement had already begun by that time. During Pontiac's War (1763–1766), Shawnee attacks reached as far east as the current county.
Shenandoah County was established in 1772. It was originally named Dunmore County for Virginia Governor John Murray, 4th Earl of Dunmore. Woodstock was the county seat. Dunmore was Virginia's last royal governor, and was forced from office during the American Revolution. During the war, in 1778 rebels renamed the county as Shenandoah.
During the Civil War, the Battle of New Market took place May 15, 1864.
Geography

According to the U.S. Census Bureau, the county has a total area of 512 square miles (1,330 km2), of which 509 square miles (1,320 km2) is land and 3.4 square miles (8.8 km2) (0.7%) is water.[3] The Fort Valley and western slopes of the Massanutten Mountain are located within the county.
Adjacent counties
- Hardy County, West Virginia – northwest
- Frederick County, Virginia – northeast
- Warren County, Virginia – east
- Page County, Virginia – southeast
- Rockingham County, Virginia – southwest
National protected areas
Demographics
| Historical population | |||
|---|---|---|---|
| Census | Pop. | %± | |
| 1790 | 10,510 | — | |
| 1800 | 13,823 | 31.5% | |
| 1810 | 13,646 | −1.3% | |
| 1820 | 18,926 | 38.7% | |
| 1830 | 19,750 | 4.4% | |
| 1840 | 11,618 | −41.2% | |
| 1850 | 13,768 | 18.5% | |
| 1860 | 13,896 | 0.9% | |
| 1870 | 14,936 | 7.5% | |
| 1880 | 18,204 | 21.9% | |
| 1890 | 19,671 | 8.1% | |
| 1900 | 20,253 | 3.0% | |
| 1910 | 20,942 | 3.4% | |
| 1920 | 20,808 | −0.6% | |
| 1930 | 20,655 | −0.7% | |
| 1940 | 20,898 | 1.2% | |
| 1950 | 21,169 | 1.3% | |
| 1960 | 21,825 | 3.1% | |
| 1970 | 22,852 | 4.7% | |
| 1980 | 27,559 | 20.6% | |
| 1990 | 31,636 | 14.8% | |
| 2000 | 35,075 | 10.9% | |
| 2010 | 41,993 | 19.7% | |
| Est. 2016 | 43,175 | [4] | 2.8% |
| U.S. Decennial Census[5] 1790–1960[6] 1900–1990[7] 1990–2000[8] 2010–2012[1] | |||
As of the 2010 United States Census, there were 41,993 people residing in the county. 93.0% were White, 1.7% Black or African American, 0.5% Asian, 0.2% Native American, 2.8% of some other race and 1.6% of two or more races. 6.1% were Hispanic or Latino (of any race). 26.4% were of American, 22.0% German, 10.3% English and 7.6% Irish ancestry.[9]
As of the census[10] of 2000, there were 35,075 people, 14,296 households, and 10,064 families residing in the county. The population density was 68 people per square mile (26/km²). There were 16,709 housing units at an average density of 33 per square mile (13/km²). The racial makeup of the county was 95.60% White, 1.17% Black or African American, 0.18% Native American, 0.35% Asian, 0.02% Pacific Islander, 1.79% from other races, and 0.89% from two or more races. 3.40% of the population were Hispanic or Latino of any race.
There were 14,296 households out of which 28.10% had children under the age of 18 living with them, 57.00% were married couples living together, 9.30% had a female householder with no husband present, and 29.60% were non-families. 25.10% of all households were made up of individuals and 11.30% had someone living alone who was 65 years of age or older. The average household size was 2.42 and the average family size was 2.86.
In the county, the population was spread out with 22.30% under the age of 18, 6.60% from 18 to 24, 27.60% from 25 to 44, 26.20% from 45 to 64, and 17.30% who were 65 years of age or older. The median age was 41 years. For every 100 females there were 94.90 males. For every 100 females age 18 and over, there were 92.80 males.
The median income for a household in the county was $39,173, and the median income for a family was $45,080. Males had a median income of $29,952 versus $22,312 for females. The per capita income for the county was $19,755. About 5.80% of families and 8.20% of the population were below the poverty line, including 12.10% of those under age 18 and 8.80% of those age 65 or over.
Transportation
- Shenandoah Valley Commuter Bus Service offers weekday commuter bus service from Northern Shenandoah Valley including Shenandoah County and Warren County to Northern Virginia and Washington, D.C. including Arlington County and Fairfax County. Origination points in Shenandoah County include Woodstock. Origination points in Warren County include Front Royal and Linden.
Major highways
Education
Private
Secondary Institutions
Primary Institutions
- Shenandoah Valley Adventist Elementary School
- Valley Baptist Christian School
Public
High schools
Elementary and Middle Schools
- W.W. Robinson Elementary School
- Peter Muhlenberg Middle School
- Ashby Lee Elementary School
- North Fork Middle School
- Sandy Hook Elementary School
- Signal Knob Middle School
Other
- Triplett Tech
- Massanutten Regional Governor's School
Communities
Towns
- Edinburg (pop. 1,041)
- Mount Jackson (pop. 1,994)
- New Market (pop. 2,146)
- Strasburg (pop. 6,398)
- Toms Brook (pop. 258)
- Woodstock (pop. 5,097)
Census-designated places
- Basye (pop. 1,253)
- Maurertown (pop. 770)
Other unincorporated communities
Politics
Shenandoah County has been a Republican stronghold in presidential elections since the turn of the last century. Being first won by a Republican Presidential nominee in 1896. It began voting 100% Republican in presidential elections from 1936 onwards. This voting record came from ticket splitting Byrd Democrats, who voted for conservative Democrats in state elections, and against liberal Democrats in federal elections. It was one of the first counties in Virginia to ditch the Democratic Party. In 1966 the county voted only slightly for Republicans over Senator Harry F Byrd Jr, due to a sizable minority of Democrats voting for the more segregationist Conservative Party of Virginia. Mark Warner was the first Democrat to win the county in any federal election since 1960, and only by a small margin in his 2008 landslide senate election.
| Year | Republican | Democratic | Third parties |
|---|---|---|---|
| 2016 | 68.7% 14,094 | 25.7% 5,273 | 5.6% 1,141 |
| 2012 | 64.7% 12,538 | 33.4% 6,469 | 1.9% 366 |
| 2008 | 62.5% 12,005 | 36.0% 6,912 | 1.6% 306 |
| 2004 | 68.9% 11,820 | 30.3% 5,186 | 0.8% 140 |
| 2000 | 66.7% 9,636 | 30.6% 4,420 | 2.7% 396 |
| 1996 | 56.0% 7,440 | 31.8% 4,224 | 12.2% 1,616 |
| 1992 | 55.7% 7,746 | 28.5% 3,956 | 15.8% 2,194 |
| 1988 | 71.7% 8,612 | 27.3% 3,276 | 1.0% 116 |
| 1984 | 76.0% 9,048 | 23.3% 2,771 | 0.7% 81 |
| 1980 | 67.1% 7,517 | 28.0% 3,137 | 4.9% 549 |
| 1976 | 64.1% 6,296 | 34.2% 3,364 | 1.7% 170 |
| 1972 | 82.5% 7,128 | 16.5% 1,422 | 1.1% 94 |
| 1968 | 62.9% 5,461 | 19.1% 1,654 | 18.0% 1,566 |
| 1964 | 55.5% 3,981 | 44.4% 3,184 | 0.0% 3 |
| 1960 | 66.9% 4,144 | 33.1% 2,053 | 0.0% 2 |
| 1956 | 69.2% 4,164 | 29.4% 1,769 | 1.4% 86 |
| 1952 | 71.1% 4,284 | 28.8% 1,734 | 0.1% 6 |
| 1948 | 64.7% 3,349 | 31.0% 1,603 | 4.4% 228 |
| 1944 | 64.1% 3,517 | 35.8% 1,962 | 0.1% 6 |
| 1940 | 58.9% 3,527 | 40.9% 2,450 | 0.2% 14 |
| 1936 | 52.3% 3,152 | 47.5% 2,861 | 0.3% 15 |
| 1932 | 48.2% 2,514 | 50.5% 2,635 | 1.3% 68 |
| 1928 | 68.3% 3,420 | 31.7% 1,589 | |
| 1924 | 48.8% 2,214 | 48.2% 2,186 | 3.0% 137 |
| 1920 | 56.1% 2,683 | 43.4% 2,077 | 0.6% 27 |
| 1916 | 48.7% 1,425 | 49.2% 1,440 | 2.1% 61 |
| 1912 | 27.6% 706 | 52.3% 1,336 | 20.1% 515 |
See also
- National Register of Historic Places listings in Shenandoah County, Virginia
- New Market Airport
- Shenandoah County Sheriff’s Office
- Shenandoah Local History Collection at James Madison University's Special Collections.
- Shenandoah Valley Miscellaneous Ledgers, Minute Books and Registers collection at James Madison University's Special Collections.
References
- 1 2 "State & County QuickFacts". United States Census Bureau. Retrieved January 5, 2014.
- ↑ "Find a County". National Association of Counties. Retrieved 2011-06-07.
- ↑ "US Gazetteer files: 2010, 2000, and 1990". United States Census Bureau. 2011-02-12. Retrieved 2011-04-23.
- ↑ "Population and Housing Unit Estimates". Retrieved June 9, 2017.
- ↑ "U.S. Decennial Census". United States Census Bureau. Retrieved January 5, 2014.
- ↑ "Historical Census Browser". University of Virginia Library. Retrieved January 5, 2014.
- ↑ "Population of Counties by Decennial Census: 1900 to 1990". United States Census Bureau. Retrieved January 5, 2014.
- ↑ "Census 2000 PHC-T-4. Ranking Tables for Counties: 1990 and 2000" (PDF). United States Census Bureau. Retrieved January 5, 2014.
- ↑ "American FactFinder"
- ↑ "American FactFinder". United States Census Bureau. Retrieved 2011-05-14.
- ↑ Leip, David. "Dave Leip's Atlas of U.S. Presidential Elections". uselectionatlas.org. Retrieved 2018-08-24.
| Wikimedia Commons has media related to Shenandoah County, Virginia. |
Places adjacent to Shenandoah County, Virginia | ||||||||||
|---|---|---|---|---|---|---|---|---|---|---|
| ||||||||||
Municipalities and communities of Shenandoah County, Virginia, United States | ||
|---|---|---|
| Towns | | |
| CDPs | ||
| Unincorporated communities | ||