Sussex County, Virginia
| Sussex County, Virginia | |
|---|---|
%2C_Sussex%2C_Virginia.jpg) Sussex County Courthouse | |
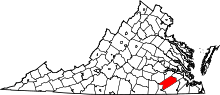 Location in the U.S. state of Virginia | |
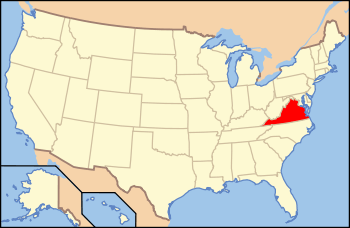 Virginia's location in the U.S. | |
| Founded | 1754 |
| Named for | Sussex, England |
| Seat | Sussex |
| Largest town | Waverly |
| Area | |
| • Total | 493 sq mi (1,277 km2) |
| • Land | 490 sq mi (1,269 km2) |
| • Water | 2.6 sq mi (7 km2), 0.5% |
| Population (est.) | |
| • (2015) | 11,715 |
| • Density | 24/sq mi (9/km2) |
| Congressional district | 4th |
| Time zone | Eastern: UTC−5/−4 |
| Website |
www |
Sussex County is a rural county located in the Commonwealth of Virginia. As of the 2010 census, the population was 12,087.[1] Its county seat is Sussex.[2] It was formed in 1754 from Surry County. The county is named after the county of Sussex, England.[3]
Sussex County is included in the Greater Richmond Region.
History
Native Americans may have settled near Cactus Hill along the Nottoway River in what became Sussex county as long as 10,000 years ago.[4] The Nottoway people, speaking an Iroquoian language, were later part of the Powhatan Confederacy.
When colonists arrived from England in 1607, some traveled along the Nottoway River, but when they established the first counties, James City County included both sides of the James River all the way to the North Carolina line. The south side of the James River became Surry County in 1652. Virginia's General Assembly formed Sussex County from the southwestern end of Surry County in 1754.
Sussex County has maintained a predominantly agricultural economy, as well as its historic heritage for over four centuries. It includes the Sussex County Courthouse Historic District and the Waverly Downtown Historic District, the Nottoway Archeological Site and six historic homes on the National Register.
The largest forest fire in Virginia's recorded history occurred on April 5, 1943, destroying more than 12,000 acres in just six hours, while most firefighters were paying their respects at the funeral of Ella Darden Gray, matriarch of one of the county's leading families, and whose son Garland Gray would become a key figure in the Massive Resistance crisis concerning desegregating Virginia's public schools about a decade later.[5]
Geography
According to the U.S. Census Bureau, the county has a total area of 493 square miles (1,280 km2), of which 490 square miles (1,300 km2) is land and 2.6 square miles (6.7 km2) (0.5%) is water.[6]
Adjacent counties
- Dinwiddie County - northwest
- Prince George County - north
- Surry County - northeast
- Southampton County - southeast
- Greensville County - southwest
Major highways


Demographics
| Historical population | |||
|---|---|---|---|
| Census | Pop. | %± | |
| 1790 | 10,549 | — | |
| 1800 | 11,062 | 4.9% | |
| 1810 | 11,362 | 2.7% | |
| 1820 | 11,884 | 4.6% | |
| 1830 | 12,720 | 7.0% | |
| 1840 | 11,229 | −11.7% | |
| 1850 | 9,820 | −12.5% | |
| 1860 | 10,175 | 3.6% | |
| 1870 | 7,885 | −22.5% | |
| 1880 | 10,062 | 27.6% | |
| 1890 | 11,100 | 10.3% | |
| 1900 | 12,082 | 8.8% | |
| 1910 | 13,664 | 13.1% | |
| 1920 | 12,834 | −6.1% | |
| 1930 | 12,100 | −5.7% | |
| 1940 | 12,485 | 3.2% | |
| 1950 | 12,785 | 2.4% | |
| 1960 | 12,411 | −2.9% | |
| 1970 | 11,464 | −7.6% | |
| 1980 | 10,874 | −5.1% | |
| 1990 | 10,248 | −5.8% | |
| 2000 | 12,504 | 22.0% | |
| 2010 | 12,087 | −3.3% | |
| Est. 2016 | 11,504 | [7] | −4.8% |
| U.S. Decennial Census[8] 1790-1960[9] 1900-1990[10] 1990-2000[11] 2010-2012[1] | |||
As of the 2010 United States Census, there were 12,087 people residing in the county, of which 58.1% were Black or African American, 39.3% White, 0.4% Asian, 0.2% Native American, 1.3% of some other race and 0.8% of two or more races. 2.2% were Hispanic or Latino (of any race).
As of the census[12] of 2000, there were 12,504 people, 4,126 households, and 2,809 families residing in the county. The population density was 26 people per square mile (10/km²). There were 4,653 housing units at an average density of 10 per square mile (4/km²). The racial makeup of the county was 62.13% Black or African American, 36.39% White, 0.13% Native American, 0.12% Asian, 0.02% Pacific Islander, 0.54% from other races, and 0.67% from two or more races. 0.82% of the population were Hispanic or Latino of any race.
There were 4,126 households out of which 28.50% had children under the age of 18 living with them, 45.00% were married couples living together, 18.90% had a female householder with no husband present, and 31.90% were non-families. 28.20% of all households were made up of individuals and 12.40% had someone living alone who was 65 years of age or older. The average household size was 2.41 and the average family size was 2.94.
In the county, the population was spread out with 19.60% under the age of 18, 9.00% from 18 to 24, 34.40% from 25 to 44, 23.60% from 45 to 64, and 13.40% who were 65 years of age or older. The median age was 38 years. For every 100 females there were 135.10 males. For every 100 females age 18 and over, there were 142.30 males.
The median income for a household in the county was $31,007, and the median income for a family was $36,739. Males had a median income of $29,307 versus $22,001 for females. The per capita income for the county was $14,670. About 12.80% of families and 16.10% of the population were below the poverty line, including 24.30% of those under age 18 and 19.20% of those age 65 or over.
Two prisons were built in Sussex County in the 1990s. Including the prisons, Sussex County was the fastest growing county in the United States. Excluding the prisons, the county population declined.[13]
Education
Sussex County Public Schools operates public schools.
Blackwater Regional Library is the regional library system that provides services to the citizens of Sussex.
High School
- Sussex Central High School
Middle School
- Sussex Central Middle School
Elementary Schools
- Sussex Central Elementary School
Charter/Tech
- Appomattox Regional Governor's School for the Arts And Technology
- Rowanty Technical Center
Private Schools
- Tidewater Academy
- Yale Seventh-day Adventist School
Government and infrastructure
The Virginia Department of Corrections operates the Sussex I State Prison and the Sussex II State Prison in unincorporated Sussex County, near Waverly.[14][15][16] The Sussex I center houses the male death row. On August 3, 1998, the male death row moved to its current location from the Mecklenburg Correctional Center.[17]
Politics
| Year | Republican | Democratic | Third parties |
|---|---|---|---|
| 2016 | 40.7% 2,055 | 57.1% 2,879 | 2.2% 110 |
| 2012 | 37.2% 2,021 | 61.7% 3,358 | 1.1% 61 |
| 2008 | 37.8% 2,026 | 61.6% 3,301 | 0.7% 36 |
| 2004 | 43.5% 1,890 | 55.7% 2,420 | 0.8% 35 |
| 2000 | 44.7% 1,745 | 51.4% 2,006 | 4.0% 155 |
| 1996 | 36.3% 1,378 | 55.1% 2,089 | 8.6% 325 |
| 1992 | 35.9% 1,527 | 51.6% 2,193 | 12.5% 533 |
| 1988 | 46.8% 1,822 | 50.3% 1,958 | 3.0% 116 |
| 1984 | 46.1% 2,183 | 50.9% 2,408 | 3.0% 140 |
| 1980 | 38.9% 1,664 | 57.3% 2,447 | 3.8% 162 |
| 1976 | 33.2% 1,360 | 61.0% 2,497 | 5.8% 237 |
| 1972 | 55.0% 2,120 | 42.7% 1,645 | 2.3% 90 |
| 1968 | 29.1% 1,105 | 40.6% 1,541 | 30.3% 1,148 |
| 1964 | 55.4% 1,537 | 44.5% 1,234 | 0.1% 4 |
| 1960 | 35.8% 713 | 62.9% 1,253 | 1.4% 27 |
| 1956 | 39.3% 785 | 42.6% 851 | 18.1% 361 |
| 1952 | 48.0% 888 | 51.7% 956 | 0.4% 7 |
| 1948 | 20.0% 244 | 50.3% 614 | 29.7% 362 |
| 1944 | 20.5% 201 | 78.9% 773 | 0.6% 6 |
| 1940 | 18.2% 164 | 81.6% 737 | 0.2% 2 |
| 1936 | 12.5% 126 | 87.5% 880 | |
| 1932 | 14.8% 122 | 83.4% 688 | 1.8% 15 |
| 1928 | 41.3% 385 | 58.7% 547 | |
| 1924 | 17.7% 132 | 81.3% 607 | 1.1% 8 |
| 1920 | 23.2% 166 | 76.4% 548 | 0.4% 3 |
| 1916 | 16.4% 96 | 82.8% 486 | 0.9% 5 |
| 1912 | 10.5% 59 | 77.5% 435 | 12.0% 67 |
Communities
Towns
Unincorporated communities
See also
References
- 1 2 "State & County QuickFacts". United States Census Bureau. Retrieved January 5, 2014.
- ↑ "Find a County". National Association of Counties. Retrieved 2011-06-07.
- ↑ "Sussex County FAQ." Retrieved on December 10, 2013.
- ↑ Gary M. Williams, Sussex County, Virginia: A Heritage Recalled by the Land (Petersburg, Virginia: The Dietz Press 2014) p. 2
- ↑ Gary M. Williams, Sussex County, Virginia: A Heritage Recalled by the Land (Petersburg, Virginia: The Dietz Press 2014) pp. 235-236
- ↑ "US Gazetteer files: 2010, 2000, and 1990". United States Census Bureau. 2011-02-12. Retrieved 2011-04-23.
- ↑ "Population and Housing Unit Estimates". Retrieved June 9, 2017.
- ↑ "U.S. Decennial Census". United States Census Bureau. Retrieved January 5, 2014.
- ↑ "Historical Census Browser". University of Virginia Library. Retrieved January 5, 2014.
- ↑ "Population of Counties by Decennial Census: 1900 to 1990". United States Census Bureau. Retrieved January 5, 2014.
- ↑ "Census 2000 PHC-T-4. Ranking Tables for Counties: 1990 and 2000" (PDF). United States Census Bureau. Retrieved January 5, 2014.
- ↑ "American FactFinder". United States Census Bureau. Retrieved 2011-05-14.
- ↑ Sommerstein, David. "Urban, Rural Areas Battle For Census Prison Populace." NPR. February 15, 2010. Retrieved on January 3, 2012. "In the early 2000s, southern Virginia's Sussex County was the fastest-growing county in the nation, according to the census. But the county had opened two prisons in the late 1990s — and if their residents weren't included, the county's population had actually declined, the Washington Post reported."
- ↑ "Sussex I State Prison." Virginia Department of Corrections. Retrieved on August 22, 2010.
- ↑ "Sussex II State Prison." Virginia Department of Corrections. Retrieved on January 3, 2013.
- ↑ "DOC Appoints New Warden at Sussex I State Prison." Virginia Department of Corrections. March 9, 2006. Retrieved on August 22, 2010.
- ↑ "Virginia Death Row/Execution Facts." My FOX DC. Tuesday November 10, 2009. Retrieved on August 22, 2010.
- ↑ Leip, David. "Dave Leip's Atlas of U.S. Presidential Elections". uselectionatlas.org. Retrieved 2018-08-24.
Coordinates: 36°56′N 77°16′W / 36.93°N 77.26°W
Places adjacent to Sussex County, Virginia | ||||||||||
|---|---|---|---|---|---|---|---|---|---|---|
| ||||||||||
Municipalities and communities of Sussex County, Virginia, United States | ||
|---|---|---|
| Towns | | |
| CDP | ||
| Unincorporated communities | ||
| Footnotes | ‡This populated place also has portions in an adjacent county or counties | |