Scott County, Virginia
| Scott County, Virginia | |
|---|---|
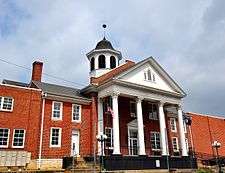 Scott County Courthouse | |
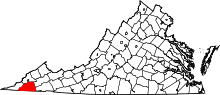 Location in the U.S. state of Virginia | |
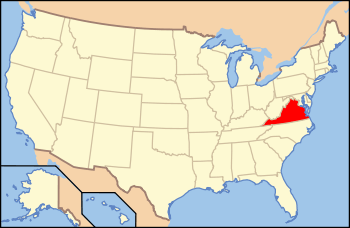 Virginia's location in the U.S. | |
| Founded | November 24, 1814 |
| Named for | Winfield Scott |
| Seat | Gate City |
| Largest town | Gate City |
| Area | |
| • Total | 539 sq mi (1,396 km2) |
| • Land | 536 sq mi (1,388 km2) |
| • Water | 3.1 sq mi (8 km2), 0.6% |
| Population (est.) | |
| • (2015) | 23,177 |
| • Density | 43/sq mi (17/km2) |
| Congressional district | 9th |
| Time zone | Eastern: UTC−5/−4 |
| Website |
www |
Scott County is a county located in the U.S. state of Virginia. As of the 2010 census, the population was 23,177.[1] Its county seat is Gate City.[2] Scott County was formed by an act of the General Assembly on November 24, 1814 from parts of Washington, Lee, and Russell Counties and was named for Virginia born General Winfield Scott.[3]
Scott County is part of the Kingsport–Bristol–Bristol, TN-VA Metropolitan Statistical Area, which is a component of the Johnson City–Kingsport–Bristol, TN-VA Combined Statistical Area, commonly known as the "Tri-Cities" region.
History
The early settlers found evidence of a former native village at the mouth of Stony Creek on the Clinch river.
Thomas McCulloch was the first white settler within the county, in 1769. Daniel Boone commanded several forts located here in 1774 during Dunmore's War, and several more were built in successive years. Even so, the Chickamauga Cherokee leader Bob Benge remained active in the area throughout this time, during the Cherokee–American wars, up until he was killed in 1794. By the times houses were built in the 1790s, the largely Scots-Irish population had increased by reason of its situation along the Wilderness Road. After Scott County was formed in 1814, the first court took place in 1815, and the first public schools in 1870.[4]
Geography
According to the U.S. Census Bureau, the county has a total area of 539 square miles (1,400 km2), of which 536 square miles (1,390 km2) is land and 3.1 square miles (8.0 km2) (0.6%) is water.[5]
Adjacent counties
- Wise County - north
- Russell County - northeast
- Washington County - east
- Sullivan County, Tennessee - southeast
- Hawkins County, Tennessee - south
- Hancock County, Tennessee - southwest
- Lee County - west
National protected area
- Jefferson National Forest (part)
Major highways
Demographics
| Historical population | |||
|---|---|---|---|
| Census | Pop. | %± | |
| 1820 | 4,263 | — | |
| 1830 | 5,724 | 34.3% | |
| 1840 | 7,303 | 27.6% | |
| 1850 | 9,829 | 34.6% | |
| 1860 | 12,072 | 22.8% | |
| 1870 | 13,036 | 8.0% | |
| 1880 | 17,233 | 32.2% | |
| 1890 | 21,694 | 25.9% | |
| 1900 | 22,694 | 4.6% | |
| 1910 | 23,814 | 4.9% | |
| 1920 | 24,776 | 4.0% | |
| 1930 | 24,181 | −2.4% | |
| 1940 | 26,989 | 11.6% | |
| 1950 | 27,640 | 2.4% | |
| 1960 | 25,813 | −6.6% | |
| 1970 | 24,376 | −5.6% | |
| 1980 | 25,068 | 2.8% | |
| 1990 | 23,204 | −7.4% | |
| 2000 | 23,403 | 0.9% | |
| 2010 | 23,177 | −1.0% | |
| Est. 2016 | 21,930 | [6] | −5.4% |
| U.S. Decennial Census[7] 1790-1960[8] 1900-1990[9] 1990-2000[10] 2010-2013[1] | |||
As of the 2010 United States Census, there were 23,177 people residing in the county. 97.9% were White, 0.6% Black or African American, 0.2% Native American, 0.2% Asian, 0.1% Pacific Islander, 0.4% of some other race and 0.7 of two or more races. 1.0% were Hispanic or Latino (of any race).
As of the census[11] of 2000, there were 23,403 people, 9,795 households, and 7,023 families residing in the county. The population density was 44 people per square mile (17/km²). There were 11,355 housing units at an average density of 21 per square mile (8/km²). The racial makeup of the county was 98.51% White, 0.59% Black or African American, 0.14% Native American, 0.07% Asian, 0.02% Pacific Islander, 0.15% from other races, and 0.52% from two or more races. 0.42% of the population were Hispanic or Latino of any race.
There were 9,795 households out of which 27.60% had children under the age of 18 living with them, 59.40% were married couples living together, 9.00% had a female householder with no husband present, and 28.30% were non-families. 26.10% of all households were made up of individuals and 13.10% had someone living alone who was 65 years of age or older. The average household size was 2.35 and the average family size was 2.82.
In the county, the population was spread out with 20.60% under the age of 18, 7.50% from 18 to 24, 27.30% from 25 to 44, 26.80% from 45 to 64, and 17.80% who were 65 years of age or older. The median age was 41 years. For every 100 females, there were 93.30 males. For every 100 females age 18 and over, there were 90.70 males.
The median income for a household in the county was $27,339, and the median income for a family was $33,163. Males had a median income of $28,328 versus $20,553 for females. The per capita income for the county was $15,073. About 13.00% of families and 16.80% of the population were below the poverty line, including 20.10% of those under age 18 and 20.50% of those age 65 or over.
Education
Public high schools
- Gate City High School, Gate City
- Rye Cove High School, Clinchport
- Twin Springs High School, Nickelsville
Communities
Towns
Unincorporated communities
- Fort Blackmore
- Hiltons
- Maces Spring
- Yuma
- Rye Cove
- Mabe
- Stanleytown
- Snowflake
- Fairview
- Daniel Boone
- Copper's Creek
Notable people
Politics

| Year | Republican | Democratic | Third parties |
|---|---|---|---|
| 2016 | 81.7% 8,247 | 15.7% 1,581 | 2.7% 272 |
| 2012 | 74.5% 7,439 | 24.0% 2,395 | 1.6% 158 |
| 2008 | 70.7% 6,980 | 27.6% 2,725 | 1.7% 170 |
| 2004 | 65.0% 6,479 | 33.4% 3,324 | 1.7% 164 |
| 2000 | 59.3% 5,535 | 38.1% 3,552 | 2.7% 248 |
| 1996 | 47.7% 4,086 | 40.2% 3,449 | 12.1% 1,038 |
| 1992 | 46.6% 4,515 | 41.1% 3,979 | 12.4% 1,196 |
| 1988 | 56.8% 4,986 | 41.2% 3,616 | 2.1% 183 |
| 1984 | 59.1% 5,804 | 39.8% 3,904 | 1.2% 113 |
| 1980 | 50.5% 4,744 | 46.0% 4,314 | 3.5% 329 |
| 1976 | 45.4% 4,313 | 47.4% 4,496 | 7.2% 685 |
| 1972 | 66.2% 5,125 | 32.0% 2,474 | 1.9% 145 |
| 1968 | 53.5% 5,345 | 31.5% 3,144 | 15.0% 1,495 |
| 1964 | 48.9% 4,533 | 50.9% 4,720 | 0.2% 16 |
| 1960 | 56.5% 4,936 | 43.3% 3,789 | 0.2% 19 |
| 1956 | 58.4% 5,116 | 41.1% 3,595 | 0.5% 43 |
| 1952 | 61.1% 4,703 | 38.9% 2,990 | |
| 1948 | 56.1% 3,520 | 42.7% 2,676 | 1.2% 76 |
| 1944 | 51.6% 3,089 | 48.3% 2,888 | 0.1% 6 |
| 1940 | 54.6% 2,982 | 45.3% 2,474 | 0.2% 8 |
| 1936 | 49.1% 2,046 | 50.9% 2,122 | |
| 1932 | 43.6% 1,673 | 55.6% 2,137 | 0.8% 31 |
| 1928 | 55.3% 2,916 | 44.7% 2,355 | |
| 1924 | 54.3% 2,666 | 44.3% 2,177 | 1.4% 69 |
| 1920 | 59.3% 2,449 | 40.5% 1,671 | 0.2% 7 |
| 1916 | 56.7% 1,743 | 42.9% 1,319 | 0.5% 15 |
| 1912 | 18.8% 557 | 44.3% 1,311 | 36.9% 1,094 |
See also
References
- 1 2 "State & County QuickFacts". United States Census Bureau. Retrieved January 5, 2014.
- ↑ "Find a County". National Association of Counties. Retrieved 2011-06-07.
- ↑ "Scott County, Virginia - Home". www.scottcountyva.com. Retrieved 2018-08-23.
- ↑ An Early History: Scott County, Virginia Economic Development AIthority Archived 2012-07-29 at the Wayback Machine.
- ↑ "US Gazetteer files: 2010, 2000, and 1990". United States Census Bureau. 2011-02-12. Retrieved 2011-04-23.
- ↑ "Population and Housing Unit Estimates". Retrieved June 9, 2017.
- ↑ "U.S. Decennial Census". United States Census Bureau. Retrieved January 5, 2014.
- ↑ "Historical Census Browser". University of Virginia Library. Retrieved January 5, 2014.
- ↑ "Population of Counties by Decennial Census: 1900 to 1990". United States Census Bureau. Retrieved January 5, 2014.
- ↑ "Census 2000 PHC-T-4. Ranking Tables for Counties: 1990 and 2000" (PDF). United States Census Bureau. Retrieved January 5, 2014.
- ↑ "American FactFinder". United States Census Bureau. Retrieved 2011-05-14.
- ↑ Leip, David. "Dave Leip's Atlas of U.S. Presidential Elections". uselectionatlas.org. Retrieved 2018-08-23.
External links
Places adjacent to Scott County, Virginia | |
|---|---|
Municipalities and communities of Scott County, Virginia, United States | ||
|---|---|---|
| Towns | | |
| Unincorporated communities | ||