United States presidential election in Virginia, 1956
|
| |||||||||||||||||||||||||||||||||
| |||||||||||||||||||||||||||||||||
| |||||||||||||||||||||||||||||||||
| |||||||||||||||||||||||||||||||||
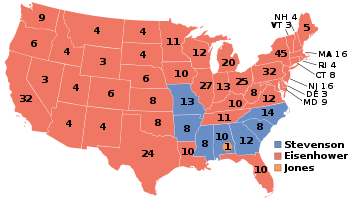
The 1956 United States presidential election in Virginia took place on November 6, 1956. Voters chose 12 representatives, or electors to the Electoral College, who voted for president and vice president.
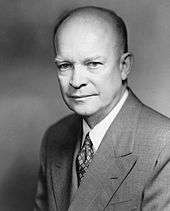
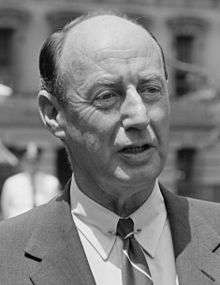
Virginia voted for the Republican nominee, incumbent President Dwight Eisenhower, over the Democratic nominee, former Illinois Governor Adlai Stevenson and former Commissioner of Internal Revenue T. Coleman Andrews, who received the nomination of the States' Rights Party. Andrews had his strongest showing in his home state of Virginia. Eisenhower ultimately won the national election with 57.37% of the vote.
As of the 2016 presidential election, this is the last election when majority-black Charles City County has voted for a Republican presidential candidate.[2]
| Elections in Virginia | ||||||||||||
|---|---|---|---|---|---|---|---|---|---|---|---|---|
 | ||||||||||||
|
||||||||||||
Results
| United States presidential election in Virginia, 1956[3] | |||||
|---|---|---|---|---|---|
| Party | Candidate | Votes | Percentage | Electoral votes | |
| Republican | Dwight Eisenhower (inc.) | 386,459 | 55.37% | 12 | |
| Democratic | Adlai Stevenson | 267,760 | 38.36% | 0 | |
| Dixiecrat/States' Rights | T. Coleman Andrews | 42,964 | 6.16% | 0 | |
| Social Democratic | Darlington Hoopes | 444 | 0.06% | 0 | |
| Socialist Labor | Eric Hass | 351 | 0.05% | 0 | |
| Totals | 697,978 | 100.00% | 12 | ||
Results by county
| Dwight David Eisenhower Republican |
Adlai Stevenson II Democratic |
Thomas Coleman Andrews States' Rights |
Various candidates Other parties |
Margin | Total votes cast[4] | ||||||
|---|---|---|---|---|---|---|---|---|---|---|---|
| County | # | % | # | % | # | % | # | % | # | % | # |
| Accomack County | 2,823 | 54.25% | 2,213 | 42.52% | 162 | 3.11% | 6 | 0.12% | 610 | 11.72% | 5,204 |
| Albemarle County | 2,508 | 57.18% | 1,412 | 32.19% | 466 | 10.62% | 0 | 0.00% | 1,096 | 24.99% | 4,386 |
| Alleghany County | 1,135 | 55.26% | 822 | 40.02% | 97 | 4.72% | 0 | 0.00% | 313 | 15.24% | 2,054 |
| Amelia County | 745 | 43.11% | 403 | 23.32% | 571 | 33.04% | 9 | 0.52% | 174[lower-alpha 2] | 10.07% | 1,728 |
| Amherst County | 1,529 | 42.59% | 1,933 | 53.84% | 124 | 3.45% | 4 | 0.11% | -404 | -11.25% | 3,590 |
| Appomattox County | 853 | 40.89% | 1,079 | 51.73% | 153 | 7.33% | 1 | 0.05% | -226 | -10.83% | 2,086 |
| Arlington County | 21,868 | 55.05% | 16,674 | 41.97% | 1,151 | 2.90% | 32 | 0.08% | 5,194 | 13.07% | 39,725 |
| Augusta County | 3,466 | 68.07% | 1,484 | 29.14% | 139 | 2.73% | 3 | 0.06% | 1,982 | 38.92% | 5,092 |
| Bath County | 739 | 58.47% | 479 | 37.90% | 45 | 3.56% | 1 | 0.08% | 260 | 20.57% | 1,264 |
| Bedford County | 3,148 | 52.07% | 2,649 | 43.81% | 241 | 3.99% | 8 | 0.13% | 499 | 8.25% | 6,046 |
| Bland County | 1,113 | 57.16% | 813 | 41.76% | 20 | 1.03% | 1 | 0.05% | 300 | 15.41% | 1,947 |
| Botetourt County | 2,280 | 60.67% | 1,377 | 36.64% | 101 | 2.69% | 0 | 0.00% | 903 | 24.03% | 3,758 |
| Brunswick County | 799 | 25.28% | 1,357 | 42.94% | 996 | 31.52% | 8 | 0.25% | 361[lower-alpha 3] | 11.42% | 3,160 |
| Buchanan County | 3,191 | 46.71% | 3,616 | 52.94% | 21 | 0.31% | 3 | 0.04% | -425 | -6.22% | 6,831 |
| Buckingham County | 751 | 43.64% | 648 | 37.65% | 312 | 18.13% | 10 | 0.58% | 103 | 5.98% | 1,721 |
| Campbell County | 2,827 | 47.79% | 2,674 | 45.20% | 401 | 6.78% | 14 | 0.24% | 153 | 2.59% | 5,916 |
| Caroline County | 907 | 46.06% | 853 | 43.32% | 202 | 10.26% | 7 | 0.36% | 54 | 2.74% | 1,969 |
| Carroll County | 4,060 | 69.66% | 1,739 | 29.84% | 24 | 0.41% | 5 | 0.09% | 2,321 | 39.82% | 5,828 |
| Charles City County | 661 | 72.08% | 174 | 18.97% | 79 | 8.62% | 3 | 0.33% | 487 | 53.11% | 917 |
| Charlotte County | 791 | 27.86% | 1,431 | 50.41% | 605 | 21.31% | 12 | 0.42% | -640 | -22.54% | 2,839 |
| Chesterfield County | 5,787 | 53.12% | 3,306 | 30.35% | 1,791 | 16.44% | 10 | 0.09% | 2,481 | 22.77% | 10,894 |
| Clarke County | 785 | 48.91% | 725 | 45.17% | 95 | 5.92% | 0 | 0.00% | 60 | 3.74% | 1,605 |
| Craig County | 485 | 48.84% | 501 | 50.45% | 7 | 0.70% | 0 | 0.00% | -16 | -1.61% | 993 |
| Culpeper County | 1,502 | 56.44% | 966 | 36.30% | 188 | 7.07% | 5 | 0.19% | 536 | 20.14% | 2,661 |
| Cumberland County | 566 | 42.91% | 331 | 25.09% | 416 | 31.54% | 6 | 0.45% | 150[lower-alpha 2] | 11.37% | 1,319 |
| Dickenson County | 3,444 | 48.15% | 3,695 | 51.66% | 8 | 0.11% | 6 | 0.08% | -251 | -3.51% | 7,153 |
| Dinwiddie County | 807 | 30.71% | 1,282 | 48.78% | 524 | 19.94% | 15 | 0.57% | -475 | -18.07% | 2,628 |
| Essex County | 597 | 55.48% | 328 | 30.48% | 149 | 13.85% | 2 | 0.19% | 269 | 25.00% | 1,076 |
| Fairfax County | 20,761 | 55.71% | 15,633 | 41.95% | 862 | 2.31% | 11 | 0.03% | 5,128 | 13.76% | 37,267 |
| Fauquier County | 2,112 | 55.55% | 1,567 | 41.22% | 122 | 3.21% | 1 | 0.03% | 545 | 14.33% | 3,802 |
| Floyd County | 1,970 | 70.46% | 799 | 28.58% | 25 | 0.89% | 2 | 0.07% | 1,171 | 41.88% | 2,796 |
| Fluvanna County | 734 | 53.85% | 417 | 30.59% | 208 | 15.26% | 4 | 0.29% | 317 | 23.26% | 1,363 |
| Franklin County | 2,125 | 48.81% | 2,142 | 49.20% | 84 | 1.93% | 3 | 0.07% | -17 | -0.39% | 4,354 |
| Frederick County | 1,882 | 56.01% | 1,405 | 41.82% | 71 | 2.11% | 2 | 0.06% | 477 | 14.20% | 3,360 |
| Giles County | 2,270 | 51.84% | 2,016 | 46.04% | 81 | 1.85% | 12 | 0.27% | 254 | 5.80% | 4,379 |
| Gloucester County | 1,319 | 57.95% | 723 | 31.77% | 223 | 9.80% | 11 | 0.48% | 596 | 26.19% | 2,276 |
| Goochland County | 748 | 50.10% | 508 | 34.03% | 233 | 15.61% | 4 | 0.27% | 240 | 16.08% | 1,493 |
| Grayson County | 4,039 | 62.18% | 2,426 | 37.35% | 26 | 0.40% | 5 | 0.08% | 1,613 | 24.83% | 6,496 |
| Greene County | 539 | 63.49% | 246 | 28.98% | 63 | 7.42% | 1 | 0.12% | 293 | 34.51% | 849 |
| Greensville County | 724 | 29.08% | 994 | 39.92% | 760 | 30.52% | 12 | 0.48% | 234[lower-alpha 3] | 9.40% | 2,490 |
| Halifax County | 1,782 | 30.73% | 2,470 | 42.59% | 1,513 | 26.09% | 34 | 0.59% | -688 | -11.86% | 5,799 |
| Hanover County | 2,272 | 54.07% | 1,109 | 26.39% | 813 | 19.35% | 8 | 0.19% | 1,163 | 27.68% | 4,202 |
| Henrico County | 12,702 | 60.20% | 5,032 | 23.85% | 3,354 | 15.89% | 13 | 0.06% | 7,670 | 36.35% | 21,101 |
| Henry County | 2,436 | 47.75% | 2,582 | 50.61% | 75 | 1.47% | 9 | 0.18% | -146 | -2.86% | 5,102 |
| Highland County | 633 | 58.02% | 432 | 39.60% | 23 | 2.11% | 3 | 0.27% | 201 | 18.42% | 1,091 |
| Isle of Wight County | 1,298 | 47.08% | 1,324 | 48.02% | 131 | 4.75% | 4 | 0.15% | -26 | -0.94% | 2,757 |
| James City County | 728 | 62.54% | 312 | 26.80% | 122 | 10.48% | 2 | 0.17% | 416 | 35.74% | 1,164 |
| King and Queen County | 495 | 54.64% | 289 | 31.90% | 116 | 12.80% | 6 | 0.66% | 206 | 22.74% | 906 |
| King George County | 655 | 51.70% | 563 | 44.44% | 47 | 3.71% | 2 | 0.16% | 92 | 7.26% | 1,267 |
| King William County | 887 | 62.16% | 357 | 25.02% | 180 | 12.61% | 3 | 0.21% | 530 | 37.14% | 1,427 |
| Lancaster County | 1,380 | 70.66% | 373 | 19.10% | 192 | 9.83% | 8 | 0.41% | 1,007 | 51.56% | 1,953 |
| Lee County | 4,548 | 54.77% | 3,714 | 44.73% | 30 | 0.36% | 12 | 0.14% | 834 | 10.04% | 8,304 |
| Loudoun County | 2,489 | 53.41% | 1,960 | 42.06% | 205 | 4.40% | 6 | 0.13% | 529 | 11.35% | 4,660 |
| Louisa County | 1,152 | 47.43% | 795 | 32.73% | 472 | 19.43% | 10 | 0.41% | 357 | 14.70% | 2,429 |
| Lunenburg County | 580 | 24.80% | 1,111 | 47.50% | 641 | 27.40% | 7 | 0.30% | 470[lower-alpha 3] | 20.09% | 2,339 |
| Madison County | 850 | 56.86% | 533 | 35.65% | 111 | 7.42% | 1 | 0.07% | 317 | 21.20% | 1,495 |
| Mathews County | 1,018 | 65.42% | 406 | 26.09% | 132 | 8.48% | 0 | 0.00% | 612 | 39.33% | 1,556 |
| Mecklenburg County | 1,498 | 33.78% | 2,004 | 45.20% | 920 | 20.75% | 12 | 0.27% | -506 | -11.41% | 4,434 |
| Middlesex County | 721 | 58.00% | 338 | 27.19% | 180 | 14.48% | 4 | 0.32% | 383 | 30.81% | 1,243 |
| Montgomery County | 4,598 | 70.10% | 1,848 | 28.18% | 106 | 1.62% | 7 | 0.11% | 2,750 | 41.93% | 6,559 |
| Nansemond County | 1,753 | 40.21% | 2,492 | 57.16% | 98 | 2.25% | 17 | 0.39% | -739 | -16.95% | 4,360 |
| Nelson County | 764 | 37.20% | 1,215 | 59.15% | 73 | 3.55% | 2 | 0.10% | -451 | -21.96% | 2,054 |
| New Kent County | 510 | 57.95% | 178 | 20.23% | 189 | 21.48% | 3 | 0.34% | 321[lower-alpha 2] | 36.48% | 880 |
| Norfolk County | 4,558 | 41.74% | 6,026 | 55.18% | 332 | 3.04% | 4 | 0.04% | -1,468 | -13.44% | 10,920 |
| Northampton County | 1,264 | 51.03% | 1,132 | 45.70% | 78 | 3.15% | 3 | 0.12% | 132 | 5.33% | 2,477 |
| Northumberland County | 1,191 | 62.68% | 428 | 22.53% | 277 | 14.58% | 4 | 0.21% | 763 | 40.16% | 1,900 |
| Nottoway County | 1,124 | 33.76% | 1,242 | 37.31% | 961 | 28.87% | 2 | 0.06% | -118 | -3.54% | 3,329 |
| Orange County | 1,344 | 53.55% | 794 | 31.63% | 363 | 14.46% | 9 | 0.36% | 550 | 21.91% | 2,510 |
| Page County | 2,372 | 62.73% | 1,358 | 35.92% | 49 | 1.30% | 2 | 0.05% | 1,014 | 26.82% | 3,781 |
| Patrick County | 1,345 | 43.93% | 1,677 | 54.77% | 38 | 1.24% | 2 | 0.07% | -332 | -10.84% | 3,062 |
| Pittsylvania County | 2,870 | 36.82% | 4,136 | 53.07% | 767 | 9.84% | 21 | 0.27% | -1,266 | -16.24% | 7,794 |
| Powhatan County | 729 | 54.08% | 297 | 22.03% | 314 | 23.29% | 8 | 0.59% | 415[lower-alpha 2] | 30.79% | 1,348 |
| Prince Edward County | 932 | 31.43% | 437 | 14.74% | 1,588 | 53.56% | 8 | 0.27% | -656[lower-alpha 2] | -22.12% | 2,965 |
| Prince George County | 689 | 46.24% | 642 | 43.09% | 149 | 10.00% | 10 | 0.67% | 47 | 3.15% | 1,490 |
| Princess Anne County | 4,675 | 50.52% | 4,342 | 46.93% | 227 | 2.45% | 9 | 0.10% | 333 | 3.60% | 9,253 |
| Prince William County | 2,023 | 50.96% | 1,851 | 46.62% | 95 | 2.39% | 1 | 0.03% | 172 | 4.33% | 3,970 |
| Pulaski County | 3,517 | 63.05% | 1,994 | 35.75% | 65 | 1.17% | 2 | 0.04% | 1,523 | 27.30% | 5,578 |
| Rappahannock County | 514 | 47.81% | 523 | 48.65% | 35 | 3.26% | 3 | 0.28% | -9 | -0.84% | 1,075 |
| Richmond County | 761 | 67.89% | 274 | 24.44% | 85 | 7.58% | 1 | 0.09% | 487 | 43.44% | 1,121 |
| Roanoke County | 7,509 | 69.83% | 2,899 | 26.96% | 342 | 3.18% | 3 | 0.03% | 4,610 | 42.87% | 10,753 |
| Rockbridge County | 2,273 | 66.50% | 1,039 | 30.40% | 106 | 3.10% | 0 | 0.00% | 1,234 | 36.10% | 3,418 |
| Rockingham County | 4,324 | 71.74% | 1,605 | 26.63% | 93 | 1.54% | 5 | 0.08% | 2,719 | 45.11% | 6,027 |
| Russell County | 3,550 | 49.14% | 3,641 | 50.40% | 25 | 0.35% | 8 | 0.11% | -91 | -1.26% | 7,224 |
| Scott County | 5,116 | 58.44% | 3,595 | 41.07% | 36 | 0.41% | 7 | 0.08% | 1,521 | 17.37% | 8,754 |
| Shenandoah County | 4,164 | 69.18% | 1,769 | 29.39% | 84 | 1.40% | 2 | 0.03% | 2,395 | 39.79% | 6,019 |
| Smyth County | 4,771 | 66.23% | 2,374 | 32.95% | 56 | 0.78% | 3 | 0.04% | 2,397 | 33.27% | 7,204 |
| Southampton County | 1,290 | 35.29% | 2,039 | 55.79% | 317 | 8.67% | 9 | 0.25% | -749 | -20.49% | 3,655 |
| Spotsylvania County | 1,244 | 51.94% | 993 | 41.46% | 154 | 6.43% | 4 | 0.17% | 251 | 10.48% | 2,395 |
| Stafford County | 1,563 | 58.94% | 978 | 36.88% | 109 | 4.11% | 2 | 0.08% | 585 | 22.06% | 2,652 |
| Surry County | 425 | 32.52% | 616 | 47.13% | 259 | 19.82% | 7 | 0.54% | -191 | -14.61% | 1,307 |
| Sussex County | 785 | 39.31% | 851 | 42.61% | 357 | 17.88% | 4 | 0.20% | -66 | -3.30% | 1,997 |
| Tazewell County | 3,960 | 52.55% | 3,495 | 46.38% | 75 | 1.00% | 5 | 0.07% | 465 | 6.17% | 7,535 |
| Warren County | 2,003 | 58.83% | 1,322 | 38.83% | 77 | 2.26% | 3 | 0.09% | 681 | 20.00% | 3,405 |
| Washington County | 4,651 | 56.38% | 3,547 | 42.99% | 45 | 0.55% | 7 | 0.08% | 1,104 | 13.38% | 8,250 |
| Westmoreland County | 1,033 | 54.45% | 695 | 36.64% | 167 | 8.80% | 2 | 0.11% | 338 | 17.82% | 1,897 |
| Wise County | 4,871 | 46.41% | 5,567 | 53.04% | 51 | 0.49% | 6 | 0.06% | -696 | -6.63% | 10,495 |
| Wythe County | 3,484 | 65.65% | 1,766 | 33.28% | 56 | 1.06% | 1 | 0.02% | 1,718 | 32.37% | 5,307 |
| York County | 1,759 | 60.10% | 1,064 | 36.35% | 100 | 3.42% | 4 | 0.14% | 695 | 23.74% | 2,927 |
| Alexandria City | 8,633 | 52.48% | 7,451 | 45.30% | 357 | 2.17% | 8 | 0.05% | 1,182 | 7.19% | 16,449 |
| Bristol City | 1,794 | 51.89% | 1,645 | 47.58% | 17 | 0.49% | 1 | 0.03% | 149 | 4.31% | 3,457 |
| Buena Vista City | 545 | 60.76% | 326 | 36.34% | 24 | 2.68% | 2 | 0.22% | 219 | 24.41% | 897 |
| Charlottesville City | 3,746 | 62.19% | 1,783 | 29.60% | 490 | 8.14% | 4 | 0.07% | 1,963 | 32.59% | 6,023 |
| Clifton Forge City | 1,125 | 61.48% | 633 | 34.59% | 71 | 3.88% | 1 | 0.05% | 492 | 26.89% | 1,830 |
| Colonial Heights City | 1,037 | 47.74% | 956 | 44.01% | 177 | 8.15% | 2 | 0.09% | 81 | 3.73% | 2,172 |
| Covington City | 1,639 | 56.34% | 1,189 | 40.87% | 79 | 2.72% | 2 | 0.07% | 450 | 15.47% | 2,909 |
| Danville City | 4,561 | 59.03% | 2,409 | 31.18% | 740 | 9.58% | 16 | 0.21% | 2,152 | 27.85% | 7,726 |
| Falls Church City | 1,462 | 53.13% | 1,233 | 44.80% | 55 | 2.00% | 2 | 0.07% | 229 | 8.32% | 2,752 |
| Fredericksburg City | 1,672 | 60.25% | 934 | 33.66% | 168 | 6.05% | 1 | 0.04% | 738 | 26.59% | 2,775 |
| Galax City | 761 | 68.31% | 346 | 31.06% | 7 | 0.63% | 0 | 0.00% | 415 | 37.25% | 1,114 |
| Hampton City | 7,432 | 57.24% | 5,108 | 39.34% | 421 | 3.24% | 22 | 0.17% | 2,324 | 17.90% | 12,983 |
| Harrisonburg City | 2,265 | 78.29% | 571 | 19.74% | 56 | 1.94% | 1 | 0.03% | 1,694 | 58.56% | 2,893 |
| Hopewell City | 1,908 | 53.91% | 1,388 | 39.22% | 235 | 6.64% | 8 | 0.23% | 520 | 14.69% | 3,539 |
| Lynchburg City | 6,806 | 64.81% | 3,362 | 32.01% | 329 | 3.13% | 5 | 0.05% | 3,444 | 32.79% | 10,502 |
| Martinsville City | 2,125 | 59.67% | 1,368 | 38.42% | 65 | 1.83% | 3 | 0.08% | 757 | 21.26% | 3,561 |
| Newport News City | 3,779 | 53.26% | 3,069 | 43.26% | 237 | 3.34% | 10 | 0.14% | 710 | 10.01% | 7,095 |
| Norfolk City | 18,650 | 54.02% | 14,571 | 42.20% | 1,285 | 3.72% | 19 | 0.06% | 4,079 | 11.81% | 34,525 |
| Norton City | 684 | 55.12% | 552 | 44.48% | 4 | 0.32% | 1 | 0.08% | 132 | 10.64% | 1,241 |
| Petersburg City | 3,166 | 58.10% | 1,882 | 34.54% | 395 | 7.25% | 6 | 0.11% | 1,284 | 23.56% | 5,449 |
| Portsmouth City | 5,390 | 47.13% | 5,683 | 49.69% | 348 | 3.04% | 15 | 0.13% | -293 | -2.56% | 11,436 |
| Radford City | 1,910 | 62.46% | 1,118 | 36.56% | 28 | 0.92% | 2 | 0.07% | 792 | 25.90% | 3,058 |
| Richmond City | 27,367 | 61.79% | 10,758 | 24.29% | 6,136 | 13.85% | 30 | 0.07% | 16,609 | 37.50% | 44,291 |
| Roanoke City | 16,708 | 69.38% | 6,751 | 28.03% | 611 | 2.54% | 12 | 0.05% | 9,957 | 41.35% | 24,082 |
| South Norfolk City | 1,521 | 42.14% | 1,871 | 51.84% | 212 | 5.87% | 5 | 0.14% | -350 | -9.70% | 3,609 |
| Staunton City | 2,908 | 74.93% | 843 | 21.72% | 129 | 3.32% | 1 | 0.03% | 2,065 | 53.21% | 3,881 |
| Suffolk City | 1,617 | 57.50% | 1,103 | 39.22% | 88 | 3.13% | 4 | 0.14% | 514 | 18.28% | 2,812 |
| Virginia Beach City | 1,355 | 53.28% | 1,111 | 43.69% | 63 | 2.48% | 14 | 0.55% | 244 | 9.59% | 2,543 |
| Warwick City | 4,872 | 56.39% | 3,406 | 39.42% | 352 | 4.07% | 10 | 0.12% | 1,466 | 16.97% | 8,640 |
| Waynesboro City | 2,049 | 71.00% | 748 | 25.92% | 89 | 3.08% | 0 | 0.00% | 1,301 | 45.08% | 2,886 |
| Williamsburg City | 775 | 62.60% | 362 | 29.24% | 99 | 8.00% | 2 | 0.16% | 413 | 33.36% | 1,238 |
| Winchester City | 2,375 | 69.46% | 945 | 27.64% | 96 | 2.81% | 3 | 0.09% | 1,430 | 41.83% | 3,419 |
| Totals | 386,459 | 55.37% | 267,760 | 38.36% | 42,964 | 6.16% | 795 | 0.11% | 118,699 | 17.01% | 697,978 |
Notes
- ↑ Although he was born in Texas and grew up in Kansas before his military career, at the time of the 1952 election Eisenhower was president of Columbia University and was, officially, a resident of New York. During his first term as president, he moved his private residence to Gettysburg, Pennsylvania, and officially changed his residency to Pennsylvania.
- 1 2 3 4 5 In this county or city where Stevenson ran third behind Andrews, margin given is Eisenhower vote minus Andrews vote and percentage given Eisenhower percentage minus Andrews percentage.
- 1 2 3 In this county or city where Eisenhower ran third behind Andrews, margin given is Stevenson vote minus Andrews vote and percentage margin Stevenson percentage minus Andrews percentage
References
- ↑ "The Presidents". David Leip. Retrieved September 27, 2017.
Eisenhower's home state for the 1956 Election was Pennsylvania
- ↑ Sullivan, Robert David; ‘How the Red and Blue Map Evolved Over the Past Century’; America Magazine in The National Catholic Review; June 29, 2016
- ↑ http://clerk.house.gov/member_info/electionInfo/1956election.pdf
- ↑ Géoelections; presidential election of 1956 Popular Vote (.xlsx file for €15)
| Candidates |
|  |
|---|---|---|
| General articles |
| |
| Local results |
| |
| Other 1956 elections | ||