St. Joseph County, Indiana
| Saint Joseph County, Indiana | ||
|---|---|---|
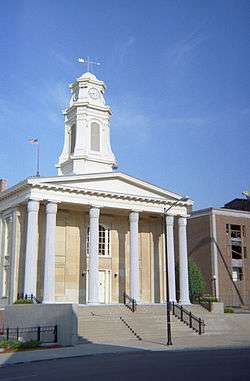 Old St. Joseph County courthouse in South Bend, Indiana | ||
| ||
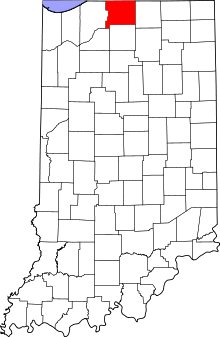 Location in the U.S. state of Indiana | ||
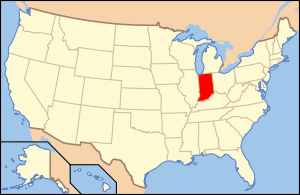 Indiana's location in the U.S. | ||
| Founded | 1830 | |
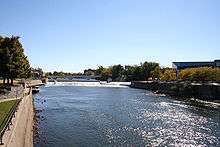
| Named for | St. Joseph River | |
| Seat | South Bend | |
| Largest city | South Bend | |
| Area | ||
| • Total | 461.38 sq mi (1,195 km2) | |
| • Land | 457.85 sq mi (1,186 km2) | |
| • Water | 3.54 sq mi (9 km2), 0.77% | |
| Population | ||
| • (2010) | 266,931 | |
| • Density | 580/sq mi (224/km2) | |
| Congressional district | 2nd | |
| Time zone | Eastern: UTC−5/−4 | |
| Website |
www | |
|
Footnotes:
| ||

St. Joseph County, commonly called St. Joe County by locals, is a county located in the U.S. state of Indiana. As of Census 2010, the population was 266,931,[1] making it the fifth-most populous county in Indiana. Formed in 1830, it was named for the St. Joseph River which flows through it toward Lake Michigan. The county seat is South Bend.[2]
St. Joseph County is part of the South Bend–Mishawaka, IN-MI, Metropolitan Statistical Area.
Geography
According to the 2010 census, the county has a total area of 461.38 square miles (1,195.0 km2), of which 457.85 square miles (1,185.8 km2) (or 99.23%) is land and 3.54 square miles (9.2 km2) (or 0.77%) is water.[3]
Cities
Towns
Census-designated places
Other unincorporated places
Townships
Adjacent counties
- Berrien County, Michigan (north)
- Cass County, Michigan (northeast)
- Elkhart County (east)
- Marshall County (south)
- Starke County (southwest/CST Border)
- LaPorte County (west/CST Border)
Major highways
Climate and weather
| South Bend, Indiana | ||||||||||||||||||||||||||||||||||||||||||||||||||||||||||||
|---|---|---|---|---|---|---|---|---|---|---|---|---|---|---|---|---|---|---|---|---|---|---|---|---|---|---|---|---|---|---|---|---|---|---|---|---|---|---|---|---|---|---|---|---|---|---|---|---|---|---|---|---|---|---|---|---|---|---|---|---|
| Climate chart (explanation) | ||||||||||||||||||||||||||||||||||||||||||||||||||||||||||||
| ||||||||||||||||||||||||||||||||||||||||||||||||||||||||||||
| ||||||||||||||||||||||||||||||||||||||||||||||||||||||||||||
In recent years, average temperatures in South Bend have ranged from a low of 16 °F (−9 °C) in January to a high of 83 °F (28 °C) in July, although a record low of −22 °F (−30 °C) was recorded in January 1943 and a record high of 109 °F (43 °C) was recorded in July 1934. Average monthly precipitation ranged from 1.98 inches (50 mm) in February to 4.19 inches (106 mm) in June.[4]
Government
The county government is a constitutional body, and is granted specific powers by the Constitution of Indiana, and by the Indiana Code.
County Council: The county council is the legislative branch of the county government and controls all the spending and revenue collection in the county. Representatives are elected from county districts. The council members serve four-year terms. They are responsible for setting salaries, the annual budget, and special spending. The council also has limited authority to impose local taxes, in the form of an income and property tax that is subject to state level approval, excise taxes, and service taxes.[5][6]
| District | Councilperson | Party |
|---|---|---|
| A | Bobby Kruszynski, Jr. | Democratic |
| B | Corey Noland | Democratic |
| C | Dick Pfeil | Republican |
| D | Rafael Morton, President | Democratic |
| E | Diana Hess | Democratic |
| F | Mark Telloyan | Republican |
| G | Mark Catanzarite, Vice President pro tem | Democratic |
| H | Robert McCahill | Democratic |
| I | Mark Root, President pro tem | Republican |
Board of Commissioners: The executive body of the county is made of a board of commissioners. The commissioners are elected county-wide, in staggered terms, and each serves a four-year term. One of the commissioners, typically the most senior, serves as president. The commissioners are charged with executing the acts legislated by the council, collecting revenue, and managing the day-to-day functions of the county government.[5][6]
| District | Commissioner | Party |
|---|---|---|
| 1 | Andrew Kostielney, President | Republican |
| 2 | Dave Thomas, Vice President | Democratic |
| 3 | Deborah Fleming | Republican |
Court: The county maintains a small claims court that can handle some civil cases. The judge on the court is elected to a term of four years and must be a member of the Indiana Bar Association. The judge is assisted by a constable who is also elected to a four-year term. In some cases, court decisions can be appealed to the state level circuit court.[6]
| Office | Judge | Party |
|---|---|---|
| Circuit Court | Michael Gotsch | Democratic |
County Officials: The county has several other elected offices, including sheriff, coroner, auditor, treasurer, recorder, surveyor, and circuit court clerk. Each of these elected officers serves a term of four years and oversees a different part of county government. Members elected to county government positions are required to declare party affiliations and to be residents of the county.[6]
| Office | Officeholder | Party |
|---|---|---|
| Assessor | Rosemary Mandrici | Democratic |
| Auditor | Mike Hamann | Democratic |
| Clerk | Terri Rethlake | Democratic |
| Coroner | Michael J. McGann | Democratic |
| Prosecutor | Ken Cotter | Democratic |
| Recorder | Phil Dotson | Democratic |
| Sheriff | Michael Grzegorek | Democratic |
| Surveyor | John McNamara | Democratic |
| Treasurer | Michael Kruk | Democratic |
St. Joseph County is part of Indiana's 2nd congressional district and is represented by Jackie Walorski in the United States Congress.[7] Indiana's US Senators are Joe Donnelly and Todd Young. Donnelly represented the 2nd district immediately before Walorski and actually defeated Walorski in the 2010 General Election.
| Year | Republican | Democratic | Third parties |
|---|---|---|---|
| 2016 | 46.5% 52,021 | 46.7% 52,252 | 6.8% 7,569 |
| 2012 | 47.4% 52,578 | 50.9% 56,460 | 1.8% 1,971 |
| 2008 | 40.9% 48,510 | 57.9% 68,710 | 1.3% 1,519 |
| 2004 | 50.9% 55,254 | 48.5% 52,637 | 0.7% 728 |
| 2000 | 48.8% 47,581 | 48.9% 47,703 | 2.3% 2,190 |
| 1996 | 41.1% 38,281 | 49.0% 45,704 | 9.9% 9,203 |
| 1992 | 37.3% 38,934 | 44.2% 46,203 | 18.5% 19,328 |
| 1988 | 50.6% 49,481 | 49.1% 48,056 | 0.3% 327 |
| 1984 | 53.1% 54,404 | 46.4% 47,513 | 0.6% 576 |
| 1980 | 49.1% 50,607 | 42.9% 44,218 | 8.0% 8,289 |
| 1976 | 50.2% 50,358 | 49.0% 49,156 | 0.8% 810 |
| 1972 | 60.6% 64,808 | 38.9% 41,629 | 0.6% 602 |
| 1968 | 44.1% 47,114 | 44.4% 47,414 | 11.5% 12,336 |
| 1964 | 37.5% 39,872 | 61.9% 65,844 | 0.6% 630 |
| 1960 | 45.6% 53,621 | 54.1% 63,553 | 0.3% 325 |
| 1956 | 51.4% 57,827 | 48.2% 54,152 | 0.4% 493 |
| 1952 | 49.7% 53,537 | 49.5% 53,269 | 0.8% 826 |
| 1948 | 43.6% 39,593 | 54.9% 49,866 | 1.5% 1,387 |
| 1944 | 45.5% 39,875 | 53.8% 47,149 | 0.7% 565 |
| 1940 | 44.0% 36,164 | 55.5% 45,620 | 0.5% 374 |
| 1936 | 36.7% 25,807 | 61.3% 43,131 | 2.0% 1,401 |
| 1932 | 41.1% 28,198 | 55.5% 38,026 | 3.4% 2,339 |
| 1928 | 57.6% 36,844 | 41.9% 26,846 | 0.5% 316 |
| 1924 | 57.7% 23,682 | 36.7% 15,056 | 5.7% 2,344 |
| 1920 | 56.5% 17,675 | 39.5% 12,355 | 4.1% 1,275 |
| 1916 | 43.0% 7,961 | 52.5% 9,709 | 4.5% 835 |
| 1912 | 20.2% 3,146 | 34.6% 5,391 | 45.3% 7,064[9] |
| 1908 | 53.9% 11,222 | 41.1% 8,562 | 5.0% 1,029 |
| 1904 | 62.5% 11,166 | 33.4% 5,967 | 4.0% 721 |
| 1900 | 53.1% 8,127 | 45.4% 6,948 | 1.5% 230 |
| 1896 | 52.8% 7,138 | 46.2% 6,247 | 1.0% 136 |
| 1892 | 44.9% 5,220 | 52.3% 6,077 | 2.8% 322 |
| 1888 | 47.4% 4,929 | 50.6% 5,257 | 2.0% 212 |
Demographics
| Historical population | |||
|---|---|---|---|
| Census | Pop. | %± | |
| 1830 | 287 | — | |
| 1840 | 6,425 | 2,138.7% | |
| 1850 | 10,954 | 70.5% | |
| 1860 | 18,455 | 68.5% | |
| 1870 | 25,322 | 37.2% | |
| 1880 | 33,178 | 31.0% | |
| 1890 | 42,457 | 28.0% | |
| 1900 | 58,881 | 38.7% | |
| 1910 | 84,312 | 43.2% | |
| 1920 | 103,304 | 22.5% | |
| 1930 | 160,033 | 54.9% | |
| 1940 | 161,823 | 1.1% | |
| 1950 | 205,058 | 26.7% | |
| 1960 | 238,614 | 16.4% | |
| 1970 | 245,045 | 2.7% | |
| 1980 | 241,617 | −1.4% | |
| 1990 | 247,052 | 2.2% | |
| 2000 | 265,559 | 7.5% | |
| 2010 | 266,931 | 0.5% | |
| Est. 2017 | 270,434 | [10] | 1.3% |
| U.S. Decennial Census[11] 1790-1960[12] 1900-1990[13] 1990-2000[14] 2010-2013[1] | |||
As of the 2010 United States Census, there were 266,931 people, 103,069 households, and 66,365 families residing in the county.[15] The population density was 583.0 inhabitants per square mile (225.1/km2). There were 114,849 housing units at an average density of 250.8 per square mile (96.8/km2).[3] The racial makeup of the county was 78.7% white, 12.7% black or African American, 1.9% Asian, 0.4% American Indian, 0.1% Pacific islander, 3.4% from other races, and 2.9% from two or more races. Those of Hispanic or Latino origin made up 7.3% of the population.[15] In terms of ancestry, 25.3% were German, 15.5% were Irish, 12.0% were Polish, 8.5% were English, and 4.5% were American.[16]
Of the 103,069 households, 32.2% had children under the age of 18 living with them, 46.1% were married couples living together, 13.6% had a female householder with no husband present, 35.6% were non-families, and 29.1% of all households were made up of individuals. The average household size was 2.48 and the average family size was 3.07. The median age was 36.2 years.[15]
The median income for a household in the county was $47,697 and the median income for a family was $57,510. Males had a median income of $45,269 versus $31,667 for females. The per capita income for the county was $23,082. About 10.7% of families and 14.6% of the population were below the poverty line, including 21.7% of those under age 18 and 7.8% of those age 65 or over.[17]
Education
School districts
John Glenn School Corporation
- North Liberty Elementary
- Walkerton Elementary
- Urey Middle School
- John Glenn High School
New Prairie United School Corporation
- Olive Township Elementary
- New Prairie Middle School
- New Prairie High School
Penn-Harris-Madison School Corporation
- Bittersweet Elementary
- Elm Road Elementary
- Elise Rogers Elementary
- Horizon Elementary
- Madison Elementary
- Mary Frank Elementary
- Meadow's Edge Elementary
- Moran Elementary
- Northpoint Elementary
- Prairie Vista Elementary
- Walt Disney Elementary
- Discovery Middle School
- Grissom Middle School
- Schmucker Middle School
- Penn High School
School City of Mishawaka
- Battell Elementary
- Beiger Elementary
- Emmons Elementary
- Hums Elementary
- LaSalle Elementary
- Liberty Elementary
- Twin Branch Elementary
- John Young Middle School
- Mishawaka High School
- Bingham Elementary School (closed)
South Bend Community School Corporation
High schools
Intermediate Centers
- Brown Intermediate Center Bird's Eye
- Clay Intermediate Center Bird's Eye
- Dickinson Intermediate Center Bird's Eye
- Edison Intermediate Center Bird's Eye
- Greene Intermediate Center Bird's Eye
- Jackson Intermediate Center Bird's Eye
- Jefferson Intermediate Center Bird's Eye
- Lasalle Intermediate Academy Bird's Eye
- Marshall Intermediate Center Bird's Eye
- Navarre Intermediate Center Bird's Eye
Primary centers
- Coquillard Primary Center Bird's Eye
- Darden Primary Center Bird's Eye
- Hamilton Primary Center Bird's Eye
- Harrison Primary Center Bird's Eye
- Hay Primary Center Bird's Eye
- Kennedy Academy Bird's Eye
- Lafayette Early Childhood Center Bird's Eye
- Lincoln Primary Center Bird's Eye
- Madison Primary Center Bird's Eye
- Marquette Primary Center Bird's Eye
- McKinley Primary Center Bird's Eye
- Monroe Primary Center Bird's Eye
- Muessel Primary Center Bird's Eye
- Nuner Primary Center Bird's Eye
- Perley Primary Center Bird's Eye
- Swanson Primary Center Bird's Eye
- Tarkington Traditional Primary Center Bird's Eye
- Warren Primary Center Bird's Eye
- Wilson Primary Center Bird's Eye
Union-North United School Corporation
- LaVille Elementary
- LaVille Junior-Senior High School
Private Schools
- Christ the King [Grades K-8]
- Corpus Christi [Grades K-8]
- Covenant Christian School [Grades K-8]
- Granger Christian School [Grades K-12]
- Holy Cross Elementary [Grades K-8]
- Holy Family Elementary [Grades K-8]
- Ironwood Christian School [Grades K-12]
- Mishawaka Catholic School (St. Bavo Campus, St. Joseph Campus & St. Monica Campus) [Grades ECD-8]
- Michiana Christian School [Grades K-5]
- Mishawaka First Baptist School [Grades K-12]
- Marian High School [Grades 9-12]
- North Liberty Christian School [Grades K-5]
- Our Lady of Hungary [Grades K-8]
- Queen of Peace School [Grades K-6]
- Resurrection Lutheran Academy [Grades Pre K-8]
- St. Adalbert Elementary [Grades K-8]
- St. Anthony de Padua School [Grades K-8]
- St. John the Baptist Elementary [Grades K-8]
- St. Joseph Grade School (South Bend) [Grades K-8]
- St. Jude Elementary [Grades K-8]
- St. Mary of the Assumption School [Grades K-8]
- St. Matthew Elementary [Grades K-8]*St. Patrick School [Grades K-6]
- St. Pius X School [Grades Pre K-8]
- South Bend Christian Center [Grades K-12]
- South Bend Junior Academy [Grades 2-8]
- South Bend St. Joseph's High School [Grades 9-12]
- South Bend Trinity School [Grades 7-12]
- Stanley Clark School [Grades K-8]
Colleges & universities
See also
References
- 1 2 "St. Joseph County QuickFacts". United States Census Bureau. Retrieved September 25, 2011.
- ↑ "Find a County". National Association of Counties. Retrieved 2011-06-07.
- 1 2 "Population, Housing Units, Area, and Density: 2010 - County". United States Census Bureau. Retrieved 2015-07-10.
- 1 2 "Monthly Averages for South Bend, Indiana". The Weather Channel. Retrieved 2011-01-27.
- 1 2 Indiana Code. "Title 36, Article 2, Section 3". IN.gov. Retrieved 2008-09-16.
- 1 2 3 4 Indiana Code. "Title 2, Article 10, Section 2" (PDF). IN.gov. Retrieved 2008-09-16.
- ↑ "US Congresswoman Jackie Walorski". US Congress. Retrieved 2013-06-05.
- ↑ Leip, David. "Dave Leip's Atlas of U.S. Presidential Elections". uselectionatlas.org. Retrieved 2018-05-20.
- ↑ The leading "other" candidate, Progressive Theodore Roosevelt, received 5,240 votes, while Socialist candidate Eugene Debs received 1,285 votes, Prohibition candidate Eugene Chafin received 452 votes, and Socialist Labor candidate Arthur Reimer received 87 votes.
- ↑ "Population and Housing Unit Estimates". Retrieved June 9, 2017.
- ↑ "U.S. Decennial Census". United States Census Bureau. Retrieved July 10, 2014.
- ↑ "Historical Census Browser". University of Virginia Library. Retrieved July 10, 2014.
- ↑ "Population of Counties by Decennial Census: 1900 to 1990". United States Census Bureau. Retrieved July 10, 2014.
- ↑ "Census 2000 PHC-T-4. Ranking Tables for Counties: 1990 and 2000" (PDF). United States Census Bureau. Retrieved July 10, 2014.
- 1 2 3 "DP-1 Profile of General Population and Housing Characteristics: 2010 Demographic Profile Data". United States Census Bureau. Retrieved 2015-07-10.
- ↑ "DP02 SELECTED SOCIAL CHARACTERISTICS IN THE UNITED STATES – 2006-2010 American Community Survey 5-Year Estimates". United States Census Bureau. Retrieved 2015-07-10.
- ↑ "DP03 SELECTED ECONOMIC CHARACTERISTICS – 2006-2010 American Community Survey 5-Year Estimates". United States Census Bureau. Retrieved 2015-07-10.
External links
Places adjacent to St. Joseph County, Indiana | ||||||||||
|---|---|---|---|---|---|---|---|---|---|---|
| ||||||||||
Municipalities and communities of St. Joseph County, Indiana, United States | ||
|---|---|---|
| Cities | ||
| Towns | ||
| Townships | ||
| CDPs | ||
| Unincorporated communities |
| |
| Footnotes | ‡This populated place also has portions in an adjacent county or counties | |