Lawrence County, Indiana
| Lawrence County, Indiana | |
|---|---|
| County | |
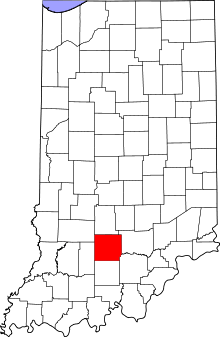 Location in the state of Indiana | |
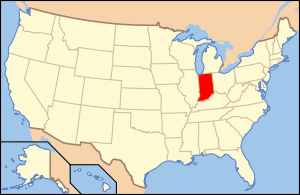 Indiana's location in the U.S. | |
| Coordinates: 38°48′N 86°33′W / 38.800°N 86.550°WCoordinates: 38°48′N 86°33′W / 38.800°N 86.550°W | |
| Country |
|
| State |
|
| Founded | 1818 |
| Named for | James Lawrence |
| County seat | Bedford |
| Largest city | Bedford (population and area) |
| Incorporated Municipalities | |
| Government | |
| • Type | County |
| • Body | Board of Commissioners |
| Area | |
| • Total | 451.93 sq mi (1,170.5 km2) |
| • Land | 449.17 sq mi (1,163.3 km2) |
| • Water | 2.76 sq mi (7.1 km2) |
| Area rank | 20th largest county in Indiana |
| Elevation[1] | 502 ft (153 m) |
| Population (2010) | |
| • Total | 46,134 |
| • Estimate (2013) | 45,844 |
| • Rank |
31st largest county in Indiana 1,050th largest county in U.S.[2] |
| • Density | 103/sq mi (40/km2) |
| Time zone | UTC−5 (Eastern) |
| • Summer (DST) | UTC−4 (Eastern) |
| ZIP Codes | 47264, 47420-21, 47436-37, 47446, 47451, 47462, 47467, 47470 |
| Area code | 812 and 930 |
| Congressional district | 9th |
| Indiana Senate district | 44th |
| Indiana House of Representatives districts | 65th and 73rd |
| FIPS code | 18-093 |
| GNIS feature ID | 0451703 |
| |
Lawrence County is a county located in the U.S. state of Indiana. As of 2010, the population was 46,134.[3] The county seat is Bedford.[4]
History
Lawrence County was formed in 1818 from land given by Orange County.[5] It was named for Capt. James Lawrence,[6] who uttered the famous words "Don't give up the ship." after being mortally wounded during the War of 1812. Until the Battle of Tippecanoe, there was a lack in population of white men, due to the fact that Native Americans still lived in the area. The first trace of settlement in Lawrence County was near Leesville, however, Bono was the first settlement in the county.[7]
Geography
According to the 2010 census, the county has a total area of 451.93 square miles (1,170.5 km2), of which 449.17 square miles (1,163.3 km2) (or 99.39%) is land and 2.76 square miles (7.1 km2) (or 0.61%) is water.[8]
Adjacent counties
- Monroe County (north)
- Jackson County (east)
- Washington County (southeast)
- Orange County (south)
- Martin County (west)
- Greene County (northwest)
Major highways
National protected area
- Hoosier National Forest (part)
Municipalities
Cities and Towns
Census-designated places
Unincorporated communities
- Bartlettsville
- Bono
- Bryantsville
- Buddha
- Coveyville
- Coxton
- Dark Hallow
- East Oolitic – (previously known as Spien Kopj)
- Erie
- Eureka
- Fayetteville
- Fort Ritner
- Georgia
- Guthrie
- Hartleyville
- Heltonville
- Huron
- Judah
- Lawrenceport
- Leesville
- Logan
- Moorestown
- Murdock
- Needmore
- Patton Hill
- Peerless
- Pinhook
- Popcorn
- Rabbitville
- Red Hill
- Redding
- Rivervale
- Shawswick
- Silverville
- Spring Mill Village
- Springville
- Stemm
- Stonington
- Tarry Park
- Tunnelton
- Yockey
- Zelma
Extinct town
Townships
Local sights
- Joe Palooka Statue – a statue of a comic strip character Joe Palooka, dedicated in 1948, is located near the town hall in Oolitic.
- Spring Mill State Park is located near Mitchell
Astronauts
Lawrence County has had several native residents that have become astronauts over the years. They include:
- Virgil I. "Gus" Grissom was born and raised in Mitchell; was killed in the Apollo 1 accident
- Charles "Charlie" Walker was born and raised in Oolitic
- Kenneth "Kenny" Bowersox was born in Virginia but was raised in Bedford
The Virgil I. Gus Grissom Memorial, located at the Spring Mill State Park near Mitchell, has many mementos of his career, including the space capsule he commanded, "The Molly Brown" from Gemini 3, and the space suit worn during his Mercury Liberty Bell 7 mission.[9]
Climate and weather
| Bedford, Indiana | ||||||||||||||||||||||||||||||||||||||||||||||||||||||||||||
|---|---|---|---|---|---|---|---|---|---|---|---|---|---|---|---|---|---|---|---|---|---|---|---|---|---|---|---|---|---|---|---|---|---|---|---|---|---|---|---|---|---|---|---|---|---|---|---|---|---|---|---|---|---|---|---|---|---|---|---|---|
| Climate chart (explanation) | ||||||||||||||||||||||||||||||||||||||||||||||||||||||||||||
| ||||||||||||||||||||||||||||||||||||||||||||||||||||||||||||
| ||||||||||||||||||||||||||||||||||||||||||||||||||||||||||||
In recent years, average temperatures in Bedford have ranged from a low of 18 °F (−8 °C) in January to a high of 86 °F (30 °C) in July, although a record low of −29 °F (−34 °C) was recorded in January 1994 and a record high of 111 °F (44 °C) was recorded in July 1930. Average monthly precipitation ranged from 2.70 inches (69 mm) in February to 5.04 inches (128 mm) in May.[10]
Government
The county government is a constitutional body, and is granted specific powers by the Constitution of Indiana, and by the Indiana Code.
County Council: The county council is the legislative branch of the county government and controls all the spending and revenue collection in the county. Representatives are elected from county districts. The council members serve four-year terms. They are responsible for setting salaries, the annual budget, and special spending. The council also has limited authority to impose local taxes, in the form of an income and property tax that is subject to state level approval, excise taxes, and service taxes.[11][12]
Board of Commissioners: The executive body of the county is made of a board of commissioners. The commissioners are elected county-wide, in staggered terms, and each serves a four-year term. One of the commissioners, typically the most senior, serves as president. The commissioners are charged with executing the acts legislated by the council, collecting revenue, and managing the day-to-day functions of the county government.[11][12]
Court: The county maintains a small claims court that can handle some civil cases. The judge on the court is elected to a term of four years and must be a member of the Indiana Bar Association. The judge is assisted by a constable who is also elected to a four-year term. In some cases, court decisions can be appealed to the state level circuit court.[12]
County Officials: The county has several other elected offices, including sheriff, coroner, auditor, treasurer, recorder, surveyor, and circuit court clerk Each of these elected officers serves a term of four years and oversees a different part of county government. Members elected to county government positions are required to declare party affiliations and to be residents of the county.[12]
Lawrence County is part of Indiana's 9th congressional district; Indiana Senate district 44;[13] and Indiana House of Representatives districts 65 and 73.[14]
| Year | Republican | Democratic | Third parties |
|---|---|---|---|
| 2016 | 73.3% 14,035 | 22.0% 4,210 | 4.7% 907 |
| 2012 | 65.0% 11,622 | 32.3% 5,779 | 2.6% 469 |
| 2008 | 59.5% 11,018 | 38.9% 7,208 | 1.7% 308 |
| 2004 | 69.0% 12,207 | 30.2% 5,346 | 0.8% 145 |
| 2000 | 66.1% 10,677 | 31.4% 5,071 | 2.4% 394 |
| 1996 | 50.6% 8,107 | 35.6% 5,703 | 13.7% 2,199 |
| 1992 | 46.0% 7,712 | 33.1% 5,557 | 20.9% 3,512 |
| 1988 | 64.7% 10,742 | 34.9% 5,787 | 0.4% 70 |
| 1984 | 66.7% 11,440 | 32.7% 5,608 | 0.6% 102 |
| 1980 | 62.7% 10,846 | 33.7% 5,826 | 3.6% 624 |
| 1976 | 53.2% 9,278 | 45.3% 7,908 | 1.5% 254 |
| 1972 | 71.6% 10,936 | 28.0% 4,278 | 0.5% 70 |
| 1968 | 54.4% 8,830 | 32.9% 5,349 | 12.7% 2,069 |
| 1964 | 48.3% 8,186 | 51.2% 8,677 | 0.6% 93 |
| 1960 | 61.2% 11,119 | 38.4% 6,977 | 0.5% 86 |
| 1956 | 63.9% 11,090 | 35.7% 6,197 | 0.3% 59 |
| 1952 | 64.6% 11,296 | 34.6% 6,044 | 0.8% 135 |
| 1948 | 58.1% 8,643 | 41.2% 6,131 | 0.6% 95 |
| 1944 | 63.4% 9,200 | 36.1% 5,246 | 0.5% 69 |
| 1940 | 61.9% 10,717 | 37.9% 6,553 | 0.2% 38 |
| 1936 | 54.9% 9,982 | 44.4% 8,062 | 0.7% 134 |
| 1932 | 49.7% 8,314 | 49.1% 8,215 | 1.3% 212 |
| 1928 | 68.7% 9,844 | 30.9% 4,428 | 0.4% 57 |
| 1924 | 60.7% 7,438 | 36.0% 4,414 | 3.3% 402 |
| 1920 | 58.2% 6,808 | 40.2% 4,709 | 1.6% 191 |
| 1916 | 52.6% 3,813 | 42.8% 3,108 | 4.6% 335 |
| 1912 | 23.9% 1,633 | 37.7% 2,579 | 38.4% 2,628[16] |
| 1908 | 53.8% 3,884 | 43.2% 3,118 | 3.1% 222 |
| 1904 | 57.9% 3,924 | 39.4% 2,672 | 2.6% 178 |
| 1900 | 57.1% 3,535 | 41.3% 2,558 | 1.6% 101 |
| 1896 | 55.7% 3,103 | 43.5% 2,421 | 0.8% 47 |
| 1892 | 52.1% 2,529 | 44.0% 2,134 | 3.9% 190 |
| 1888 | 55.2% 2,256 | 44.4% 1,814 | 0.3% 14 |
Demographics
| Historical population | |||
|---|---|---|---|
| Census | Pop. | %± | |
| 1820 | 4,116 | — | |
| 1830 | 9,234 | 124.3% | |
| 1840 | 11,782 | 27.6% | |
| 1850 | 12,097 | 2.7% | |
| 1860 | 13,692 | 13.2% | |
| 1870 | 14,628 | 6.8% | |
| 1880 | 18,543 | 26.8% | |
| 1890 | 19,792 | 6.7% | |
| 1900 | 25,729 | 30.0% | |
| 1910 | 30,625 | 19.0% | |
| 1920 | 28,228 | −7.8% | |
| 1930 | 35,583 | 26.1% | |
| 1940 | 35,045 | −1.5% | |
| 1950 | 34,346 | −2.0% | |
| 1960 | 36,564 | 6.5% | |
| 1970 | 38,038 | 4.0% | |
| 1980 | 42,472 | 11.7% | |
| 1990 | 42,836 | 0.9% | |
| 2000 | 45,922 | 7.2% | |
| 2010 | 46,134 | 0.5% | |
| Est. 2016 | 45,518 | [17] | −1.3% |
| U.S. Decennial Census[18] 1790-1960[19] 1900-1990[20] 1990-2000[21] 2010-2013[3] | |||
As of the 2010 United States Census, there were 46,134 people, 18,811 households, and 12,906 families residing in the county.[22] The population density was 102.7 inhabitants per square mile (39.7/km2). There were 21,074 housing units at an average density of 46.9 per square mile (18.1/km2).[8] The racial makeup of the county was 97.3% white, 0.5% Asian, 0.4% black or African American, 0.3% American Indian, 0.3% from other races, and 1.1% from two or more races. Those of Hispanic or Latino origin made up 1.2% of the population.[22] In terms of ancestry, 18.4% were German, 14.6% were Irish, 13.1% were American, and 10.4% were English.[23]
Of the 18,811 households, 31.2% had children under the age of 18 living with them, 54.1% were married couples living together, 10.1% had a female householder with no husband present, 31.4% were non-families, and 27.3% of all households were made up of individuals. The average household size was 2.42 and the average family size was 2.92. The median age was 41.6 years.[22]
The median income for a household in the county was $47,697 and the median income for a family was $50,355. Males had a median income of $42,337 versus $30,386 for females. The per capita income for the county was $21,352. About 10.9% of families and 15.8% of the population were below the poverty line, including 23.4% of those under age 18 and 10.6% of those age 65 or over.[24]
See also
References
- ↑ "Lawrence County". Geographic Names Information System. United States Geological Survey.
- ↑ "USA Counties in Profile". STATS Indiana. Retrieved 2015-01-18.
- 1 2 "Lawrence County QuickFacts". United States Census Bureau. Archived from the original on 2011-07-13. Retrieved 2011-09-25.
- ↑ "Find a County". National Association of Counties. Retrieved 2011-06-07.
- ↑ History of Lawrence and Monroe Counties, Indiana: Their People, Industries, and Institutions. B.F. Bowen. 1914. p. 64.
- ↑ History of Lawrence, Orange, and Washington Counties, Indiana: From the Earliest Time to the Present, Together with Interesting Biographical Sketches, Reminiscences, Notes, Etc. Higginson Book Company. 1884. p. 34.
- ↑ "History of Lawrence County, Indiana". INGenWeb. Retrieved July 26, 2016.
- 1 2 "Population, Housing Units, Area, and Density: 2010 - County". United States Census Bureau. Retrieved 2015-07-10.
- ↑ , Virgil I. Gus Grissom Memorial
- 1 2 "Monthly Averages for Bedford, Indiana". The Weather Channel. Retrieved 2011-01-27.
- 1 2 Indiana Code. "Title 36, Article 2, Section 3". IN.gov. Retrieved 2008-09-16.
- 1 2 3 4 Indiana Code. "Title 2, Article 10, Section 2" (PDF). IN.gov. Retrieved 2008-09-16.
- ↑ "Indiana Senate Districts" (PDF). State of Indiana. Retrieved 2015-01-19.
- ↑ "Indiana House Districts" (PDF). State of Indiana. Retrieved 2015-01-19.
- ↑ Leip, David. "Dave Leip's Atlas of U.S. Presidential Elections". uselectionatlas.org. Retrieved 2018-05-18.
- ↑ The leading "other" candidate, Progressive Theodore Roosevelt, received 2,106 votes, while Socialist candidate Eugene Debs received 398 votes, Prohibition candidate Eugene Chafin received 91 votes, and Socialist Labor candidate Arthur Reimer received 33 votes.
- ↑ "Population and Housing Unit Estimates". Retrieved June 9, 2017.
- ↑ "U.S. Decennial Census". United States Census Bureau. Retrieved July 10, 2014.
- ↑ "Historical Census Browser". University of Virginia Library. Retrieved July 10, 2014.
- ↑ "Population of Counties by Decennial Census: 1900 to 1990". United States Census Bureau. Retrieved July 10, 2014.
- ↑ "Census 2000 PHC-T-4. Ranking Tables for Counties: 1990 and 2000" (PDF). United States Census Bureau. Retrieved July 10, 2014.
- 1 2 3 "DP-1 Profile of General Population and Housing Characteristics: 2010 Demographic Profile Data". United States Census Bureau. Retrieved 2015-07-10.
- ↑ "DP02 SELECTED SOCIAL CHARACTERISTICS IN THE UNITED STATES – 2006-2010 American Community Survey 5-Year Estimates". United States Census Bureau. Retrieved 2015-07-10.
- ↑ "DP03 SELECTED ECONOMIC CHARACTERISTICS – 2006-2010 American Community Survey 5-Year Estimates". United States Census Bureau. Retrieved 2015-07-10.
External links
Places adjacent to Lawrence County, Indiana | ||||||||||
|---|---|---|---|---|---|---|---|---|---|---|
| ||||||||||