Macon County, Illinois
| Macon County, Illinois | |
|---|---|
 | |
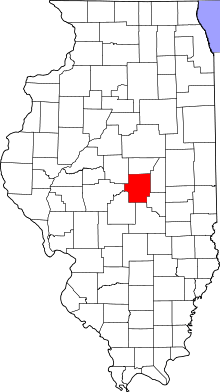 Location in the U.S. state of Illinois | |
 Illinois's location in the U.S. | |
| Founded | 1829 |
| Named for | Nathaniel Macon |
| Seat | Decatur |
| Largest city | Decatur |
| Area | |
| • Total | 586 sq mi (1,518 km2) |
| • Land | 581 sq mi (1,505 km2) |
| • Water | 5.2 sq mi (13 km2), 0.9% |
| Population | |
| • (2010) | 110,768 |
| • Density | 191/sq mi (74/km2) |
| Congressional district | 13th |
| Time zone | Central: UTC−6/−5 |
| Website |
www |
Macon County is a county located in the U.S. state of Illinois. According to the 2010 census, it had a population of 110,768.[1] Its county seat is Decatur.[2]
Macon County comprises the Decatur, IL Metropolitan Statistical Area.
History
Macon County was formed on January 19, 1829 out of Shelby County. It was named for Nathaniel Macon, who served as a Colonel in the Revolutionary War.[3] Macon later served as senator from North Carolina until his resignation in 1828. In 1830, future President Abraham Lincoln and his family moved to Macon County.
 Macon County from the time of its creation to 1829
 Macon County between 1829 and 1841
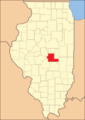 Macon County between 1841 and 1843
 Macon County in 1843, reduced to its present borders
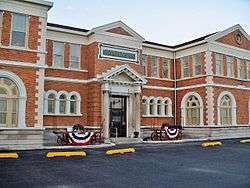
Macon County Sheriff’s Office
Geography
According to the U.S. Census Bureau, the county has a total area of 586 square miles (1,520 km2), of which 581 square miles (1,500 km2) is land and 5.2 square miles (13 km2) (0.9%) is water.[4]
Macon County is primarily flat, as is most of the state and all of the surrounding counties, the result of geological activity during the Pleistocene epoch. During the Illinoian Stage of the Pleistocene, the Laurentide ice sheet covered roughly 85 percent of Illinois, including all of present-day Macon County. The subsequent thaw of the region and retreat of the ice sheet left central Illinois with the characteristic flat topography which it is known for today.[5]
Because of its central location, Macon County is often referred to as "The Heart of Illinois."[6]
Climate and weather
| Decatur, Illinois | ||||||||||||||||||||||||||||||||||||||||||||||||||||||||||||
|---|---|---|---|---|---|---|---|---|---|---|---|---|---|---|---|---|---|---|---|---|---|---|---|---|---|---|---|---|---|---|---|---|---|---|---|---|---|---|---|---|---|---|---|---|---|---|---|---|---|---|---|---|---|---|---|---|---|---|---|---|
| Climate chart (explanation) | ||||||||||||||||||||||||||||||||||||||||||||||||||||||||||||
| ||||||||||||||||||||||||||||||||||||||||||||||||||||||||||||
| ||||||||||||||||||||||||||||||||||||||||||||||||||||||||||||
In recent years, average temperatures in the county seat of Decatur have ranged from a low of 17 °F (−8 °C) in January to a high of 88 °F (31 °C) in July, although a record low of −25 °F (−32 °C) was recorded in February 1905 and a record high of 113 °F (45 °C) was recorded in July 1954. Average monthly precipitation ranged from 1.95 inches (50 mm) in February to 4.54 inches (115 mm) in July.[7]
Major highways
Adjacent counties
Demographics
| Historical population | |||
|---|---|---|---|
| Census | Pop. | %± | |
| 1830 | 1,122 | — | |
| 1840 | 3,039 | 170.9% | |
| 1850 | 3,988 | 31.2% | |
| 1860 | 13,738 | 244.5% | |
| 1870 | 26,481 | 92.8% | |
| 1880 | 30,665 | 15.8% | |
| 1890 | 38,083 | 24.2% | |
| 1900 | 44,003 | 15.5% | |
| 1910 | 54,186 | 23.1% | |
| 1920 | 65,175 | 20.3% | |
| 1930 | 81,731 | 25.4% | |
| 1940 | 84,693 | 3.6% | |
| 1950 | 98,853 | 16.7% | |
| 1960 | 118,257 | 19.6% | |
| 1970 | 125,010 | 5.7% | |
| 1980 | 131,375 | 5.1% | |
| 1990 | 117,206 | −10.8% | |
| 2000 | 114,706 | −2.1% | |
| 2010 | 110,768 | −3.4% | |
| Est. 2016 | 106,550 | [8] | −3.8% |
| U.S. Decennial Census[9] 1790-1960[10] 1900-1990[11] 1990-2000[12] 2010-2013[1] | |||
As of the 2010 United States Census, there were 110,768 people, 45,855 households, and 29,326 families residing in the county.[13] The population density was 190.8 inhabitants per square mile (73.7/km2). There were 50,475 housing units at an average density of 86.9 per square mile (33.6/km2).[4] The racial makeup of the county was 79.3% white, 16.3% black or African American, 1.0% Asian, 0.2% American Indian, 0.7% from other races, and 2.5% from two or more races. Those of Hispanic or Latino origin made up 1.9% of the population.[13] In terms of ancestry, 21.7% were German, 17.0% were American, 12.9% were Irish, and 10.8% were English.[14]
Of the 45,855 households, 29.5% had children under the age of 18 living with them, 45.7% were married couples living together, 14.1% had a female householder with no husband present, 36.0% were non-families, and 30.9% of all households were made up of individuals. The average household size was 2.33 and the average family size was 2.89. The median age was 40.3 years.[13]
The median income for a household in the county was $44,337 and the median income for a family was $57,570. Males had a median income of $48,570 versus $31,568 for females. The per capita income for the county was $24,726. About 10.3% of families and 15.7% of the population were below the poverty line, including 26.1% of those under age 18 and 6.5% of those age 65 or over.[15]
Communities
Cities
Villages
Census-designated place
Other unincorporated communities
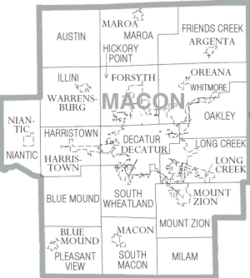
Townships
- Austin
- Blue Mound
- Decatur
- Friends Creek
- Harristown
- Hickory Point
- Illini
- Long Creek
- Maroa
- Milam (former, now defunct, after merger with Mount Zion Township)
- Mount Zion
- Niantic
- Oakley
- Pleasant View
- South Macon
- South Wheatland
- Whitmore
Politics
In its early years Macon County favoured the Democratic Party, for whom it voted in every election up to 1856. Republican Abraham Lincoln won the county in his landmark 1860 election, and from then until the Great depression Macon County became solidly Republican, only giving a very narrow plurality to Woodrow Wilson in 1912 when the GOP was mortally divided.
The New Deal saw the county turn Democratic again due to its strong industrial base, although Macon was a perfect bellwether between 1932 and 1996 apart from the Catholicism-influenced 1960 election and the 1988 election heavily influenced by a major Midwestern drought. Al Gore did narrowly hold the county in 2000 despite losing the election due to a razor-thin loss in Florida, but since then the county has trended Republican. Illinois-bred Barack Obama did win Macon County in his 2008 triumph, but was convincingly defeated by Mitt Romney in 2012, whilst in 2016 Hilary Clinton suffered the worst Democratic loss since George McGovern.
| Year | Republican | Democratic | Third Parties |
|---|---|---|---|
| 2016 | 55.9% 26,866 | 38.2% 18,343 | 5.9% 2,851 |
| 2012 | 51.6% 25,309 | 46.5% 22,780 | 1.9% 941 |
| 2008 | 48.6% 24,948 | 49.6% 25,487 | 1.9% 954 |
| 2004 | 54.3% 28,118 | 45.1% 23,341 | 0.6% 287 |
| 2000 | 48.1% 23,830 | 49.0% 24,262 | 2.8% 1,407 |
| 1996 | 38.5% 18,161 | 51.4% 24,256 | 10.2% 4,818 |
| 1992 | 33.6% 18,684 | 49.4% 27,449 | 17.0% 9,447 |
| 1988 | 48.2% 23,862 | 51.3% 25,364 | 0.5% 263 |
| 1984 | 54.3% 30,457 | 45.4% 25,463 | 0.3% 192 |
| 1980 | 52.5% 28,298 | 41.4% 22,325 | 6.2% 3,333 |
| 1976 | 46.4% 24,893 | 52.7% 28,243 | 0.9% 463 |
| 1972 | 59.2% 29,596 | 40.6% 20,296 | 0.3% 137 |
| 1968 | 42.3% 21,027 | 47.0% 23,369 | 10.8% 5,345 |
| 1964 | 33.9% 17,957 | 66.1% 35,045 | |
| 1960 | 51.0% 27,151 | 48.9% 26,029 | 0.2% 108 |
| 1956 | 54.5% 27,673 | 45.4% 23,066 | 0.1% 32 |
| 1952 | 53.6% 25,744 | 46.4% 22,277 | 0.1% 45 |
| 1948 | 46.3% 18,719 | 53.1% 21,487 | 0.6% 250 |
| 1944 | 46.1% 19,608 | 53.6% 22,808 | 0.4% 153 |
| 1940 | 41.8% 19,998 | 57.6% 27,589 | 0.6% 277 |
| 1936 | 35.8% 15,585 | 62.9% 27,360 | 1.2% 541 |
| 1932 | 42.9% 16,868 | 55.0% 21,638 | 2.1% 840 |
| 1928 | 70.7% 24,492 | 28.7% 9,932 | 0.7% 230 |
| 1924 | 60.2% 16,458 | 24.4% 6,670 | 15.4% 4,203 |
| 1920 | 65.3% 16,486 | 31.4% 7,917 | 3.4% 854 |
| 1916 | 52.9% 13,997 | 42.3% 11,181 | 4.9% 1,283 |
| 1912 | 27.3% 3,356 | 36.1% 4,435 | 36.5% 4,487[lower-alpha 1] |
| 1908 | 56.0% 6,643 | 38.9% 4,615 | 5.1% 608 |
| 1904 | 62.8% 6,284 | 29.5% 2,952 | 7.7% 772 |
| 1900 | 54.3% 6,086 | 43.5% 4,874 | 2.3% 256 |
| 1896 | 55.7% 6,216 | 42.6% 4,756 | 1.6% 182 |
| 1892 | 48.0% 4,575 | 45.2% 4,303 | 6.8% 646 |
See also
Notes
- ↑ There were only 3,976 votes for the leading “other” candidate, Progressive Theodore Roosevelt, plus 293 for Socialist Eugene V. Debs, 192 for the Prohibition Party's Eugene Chafin, and 26 for Socialist Labor candidate Arthur Reimer.
References
- 1 2 "State & County QuickFacts". United States Census Bureau. Archived from the original on July 14, 2011. Retrieved July 7, 2014.
- ↑ "Find a County". National Association of Counties. Archived from the original on 2011-05-31. Retrieved 2011-06-07.
- ↑ Gannett, Henry (1905). The Origin of Certain Place Names in the United States. U.S. Government Printing Office. p. 195.
- 1 2 "Population, Housing Units, Area, and Density: 2010 - County". United States Census Bureau. Retrieved 2015-07-12.
- ↑ Stiff, B. J., and A.K. Hansel, 2004, Quaternary glaciations in Illinois. in Ehlers, J., and P.L. Gibbard, eds., pp. 71-82, Quaternary Glaciations: Extent and Chronology 2: Part II North America, Elsevier, Amsterdam. ISBN 0-444-51462-7
- ↑ "Visitors Information - Macon County Illinois". www.co.macon.il.us. Archived from the original on 7 September 2017. Retrieved 1 May 2018.
- 1 2 "Monthly Averages for Decatur, Illinois". The Weather Channel. Archived from the original on 2012-10-23. Retrieved 2011-01-27.
- ↑ "Population and Housing Unit Estimates". Archived from the original on May 29, 2017. Retrieved June 9, 2017.
- ↑ "U.S. Decennial Census". United States Census Bureau. Archived from the original on May 12, 2015. Retrieved July 7, 2014.
- ↑ "Historical Census Browser". University of Virginia Library. Archived from the original on August 16, 2012. Retrieved July 7, 2014.
- ↑ "Population of Counties by Decennial Census: 1900 to 1990". United States Census Bureau. Archived from the original on April 24, 2014. Retrieved July 7, 2014.
- ↑ "Census 2000 PHC-T-4. Ranking Tables for Counties: 1990 and 2000" (PDF). United States Census Bureau. Archived (PDF) from the original on December 18, 2014. Retrieved July 7, 2014.
- 1 2 3 "DP-1 Profile of General Population and Housing Characteristics: 2010 Demographic Profile Data". United States Census Bureau. Retrieved 2015-07-12.
- ↑ "DP02 SELECTED SOCIAL CHARACTERISTICS IN THE UNITED STATES – 2006-2010 American Community Survey 5-Year Estimates". United States Census Bureau. Retrieved 2015-07-12.
- ↑ "DP03 SELECTED ECONOMIC CHARACTERISTICS – 2006-2010 American Community Survey 5-Year Estimates". United States Census Bureau. Retrieved 2015-07-12.
- ↑ Leip, David. "Dave Leip's Atlas of U.S. Presidential Elections". uselectionatlas.org. Archived from the original on 23 March 2018. Retrieved 1 May 2018.
Places adjacent to Macon County, Illinois | ||||||||||
|---|---|---|---|---|---|---|---|---|---|---|
| ||||||||||
Municipalities and communities of Macon County, Illinois, United States | ||
|---|---|---|
| Cities | ||
| Villages | ||
| Townships | ||
| CDP | ||
| Other unincorporated communities | ||
| Ghost towns |
| |
