Hardeman County, Tennessee
| Hardeman County, Tennessee | |
|---|---|
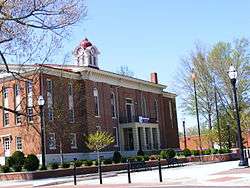 Hardeman County Courthouse in Bolivar | |
|
Location in the U.S. state of Tennessee | |
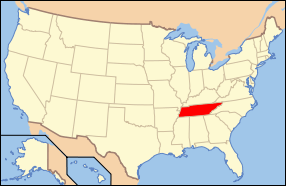 Tennessee's location in the U.S. | |
| Founded | 1823 |
| Named for | Thomas J. Hardeman[1] |
| Seat | Bolivar |
| Largest city | Bolivar |
| Area | |
| • Total | 670 sq mi (1,735 km2) |
| • Land | 668 sq mi (1,730 km2) |
| • Water | 2.6 sq mi (7 km2), 0.4% |
| Population | |
| • (2010) | 27,253 |
| • Density | 41/sq mi (16/km2) |
| Congressional district | 7th |
| Time zone | Central: UTC−6/−5 |
Hardeman County is a county located in the U.S. state of Tennessee. As of the 2010 census, the population was 27,253.[2] Its county seat is Bolivar.[3]
History
Hardeman County was created by the Tennessee General Assembly in 1823 from parts of Hardin County and "Indian lands." It is named for Thomas J. Hardeman[4] (1788-1854), a veteran of the Creek War and War of 1812 and a prominent figure in the fight for Texas independence. He served as a congressman in the Republic of Texas.[1] The county is the location of two of Tennessee's four private prisons, the Whiteville Correctional Facility and the Hardeman County Correctional Center. Both are medium-security facilities for men, operated by the Corrections Corporation of America.[5][6]
Geography
According to the U.S. Census Bureau, the county has a total area of 670 square miles (1,700 km2), of which 668 square miles (1,730 km2) is land and 2.6 square miles (6.7 km2) (0.4%) is water.[7] It is the fifth-largest county in Tennessee by area.
Adjacent counties
- Madison County (north)
- Chester County (northeast)
- McNairy County (east)
- Alcorn County, Mississippi (southeast)
- Tippah County, Mississippi (south)
- Benton County, Mississippi (southwest)
- Fayette County (west)
- Haywood County (northwest)
National protected areas
State protected areas
- Chickasaw State Park (part)
Demographics
| Historical population | |||
|---|---|---|---|
| Census | Pop. | %± | |
| 1830 | 11,655 | — | |
| 1840 | 14,563 | 25.0% | |
| 1850 | 17,456 | 19.9% | |
| 1860 | 17,769 | 1.8% | |
| 1870 | 18,074 | 1.7% | |
| 1880 | 22,921 | 26.8% | |
| 1890 | 21,029 | −8.3% | |
| 1900 | 22,976 | 9.3% | |
| 1910 | 23,011 | 0.2% | |
| 1920 | 22,278 | −3.2% | |
| 1930 | 22,193 | −0.4% | |
| 1940 | 23,590 | 6.3% | |
| 1950 | 23,311 | −1.2% | |
| 1960 | 21,517 | −7.7% | |
| 1970 | 22,435 | 4.3% | |
| 1980 | 23,873 | 6.4% | |
| 1990 | 23,377 | −2.1% | |
| 2000 | 28,105 | 20.2% | |
| 2010 | 27,253 | −3.0% | |
| Est. 2016 | 25,435 | [8] | −6.7% |
| U.S. Decennial Census[9] 1790-1960[10] 1900-1990[11] 1990-2000[12] 2010-2014[2] | |||

As of the census[14] of 2010 the racial makeup of the county was 56.1% White (non-Hispanic) or European American, 41.01% Black or African American, 0.24% Native American, 0.29% Asian, 0.01% Pacific Islander, 0.2% from other races, and 0.79% from two or more races. 0.96% of the population were Hispanic or Latino of any race.
As of the census[14] of 2000, there were 28,105 people, 9,412 households, and 6,767 families residing in the county. The population density was 42 people per square mile (16/km²). There were 10,694 housing units at an average density of 16 per square mile (6/km²). The racial makeup of the county was 57.34% White (non-Hispanic) or European American, 40.97% Black or African American, 0.26% Native American, 0.31% Asian, 0.02% Pacific Islander, 0.30% from other races, and 0.79% from two or more races. 0.97% of the population were Hispanic or Latino of any race.
There were 9,412 households out of which 32.60% had children under the age of 18 living with them, 50.00% were married couples living together, 17.60% had a female householder with no husband present, and 28.10% were non-families. 25.10% of all households were made up of individuals and 11.40% had someone living alone who was 65 years of age or older. The average household size was 2.56 and the average family size was 3.06.
In the county, the population was spread out with 23.90% under the age of 18, 9.80% from 18 to 24, 31.30% from 25 to 44, 22.40% from 45 to 64, and 12.60% who were 65 years of age or older. The median age was 36 years. For every 100 females there were 116.90 males. For every 100 females age 18 and over, there were 121.40 males.
The median income for a household in the county was $29,111, and the median income for a family was $34,746. Males had a median income of $27,828 versus $20,759 for females. The per capita income for the county was $13,349. About 16.90% of families and 19.70% of the population were below the poverty line, including 24.40% of those under age 18 and 20.80% of those age 65 or over.
Communities
Cities
- Bolivar (county seat)
- Grand Junction (partial)
Towns
- Hickory Valley
- Hornsby
- Middleton
- Saulsbury
- Silerton (partial)
- Toone
- Whiteville
Unincorporated communities
Politics
Hardeman County is the only county within Tennessee that is a "Pivot County" (one which voted for Obama in 2008 & 2012 and for Trump in 2016).
| Year | Republican | Democratic | Third Parties |
|---|---|---|---|
| 2016 | 53.1% 4,919 | 45.1% 4,185 | 1.8% 169 |
| 2012 | 46.6% 4,865 | 52.5% 5,482 | 0.9% 92 |
| 2008 | 46.5% 5,225 | 52.7% 5,919 | 0.8% 93 |
| 2004 | 45.0% 4,704 | 54.3% 5,685 | 0.7% 77 |
| 2000 | 42.4% 3,729 | 56.3% 4,953 | 1.4% 121 |
| 1996 | 36.0% 2,961 | 59.0% 4,859 | 5.0% 411 |
| 1992 | 36.2% 3,122 | 56.0% 4,832 | 7.8% 673 |
| 1988 | 49.7% 3,547 | 49.4% 3,526 | 0.9% 65 |
| 1984 | 48.7% 3,712 | 49.8% 3,797 | 1.5% 117 |
| 1980 | 40.7% 2,931 | 57.6% 4,153 | 1.7% 121 |
| 1976 | 36.0% 2,254 | 62.7% 3,934 | 1.3% 82 |
| 1972 | 66.0% 3,494 | 29.3% 1,550 | 4.7% 250 |
| 1968 | 20.2% 1,171 | 29.5% 1,709 | 50.4% 2,924 |
| 1964 | 47.8% 2,450 | 52.2% 2,675 | |
| 1960 | 44.4% 1,601 | 47.5% 1,711 | 8.1% 292 |
| 1956 | 24.4% 818 | 52.3% 1,754 | 23.3% 781 |
| 1952 | 31.2% 1,256 | 68.2% 2,747 | 0.7% 26 |
| 1948 | 9.6% 317 | 48.8% 1,609 | 41.6% 1,374 |
| 1944 | 18.5% 444 | 81.2% 1,949 | 0.3% 7 |
| 1940 | 11.1% 319 | 88.7% 2,549 | 0.2% 7 |
| 1936 | 7.7% 157 | 92.1% 1,869 | 0.2% 3 |
| 1932 | 10.5% 281 | 88.7% 2,377 | 0.8% 22 |
| 1928 | 25.0% 491 | 74.1% 1,453 | 0.9% 17 |
| 1924 | 13.4% 254 | 83.6% 1,586 | 3.0% 57 |
| 1920 | 28.6% 895 | 70.7% 2,212 | 0.7% 23 |
| 1916 | 21.9% 485 | 77.8% 1,724 | 0.3% 7 |
| 1912 | 16.7% 320 | 69.1% 1,323 | 14.2% 272 |
See also
- National Register of Historic Places listings in Hardeman County, Tennessee
- John Chisum
- Bailey Hardeman, brother of Thomas J. Hardeman
- Hardeman County, Texas
References
- 1 2 Faye Tennyson Davidson, "Hardeman County," Tennessee Encyclopedia of History and Culture. Retrieved: 16 October 2013.
- 1 2 "State & County QuickFacts". United States Census Bureau. Archived from the original on July 11, 2011. Retrieved December 2, 2013.
- ↑ "Find a County". National Association of Counties. Retrieved 2011-06-07.
- ↑ "HAIRSTON - (surname unknown) Mary Ophelia POLK". www.hairston.org. Retrieved 2018-03-10.
- ↑ "Archived copy". Archived from the original on 2014-04-12. Retrieved 2014-03-21.
- ↑ "Archived copy". Archived from the original on 2014-04-12. Retrieved 2014-03-21.
- ↑ "2010 Census Gazetteer Files". United States Census Bureau. August 22, 2012. Retrieved April 5, 2015.
- ↑ "Population and Housing Unit Estimates". Retrieved June 9, 2017.
- ↑ "U.S. Decennial Census". United States Census Bureau. Retrieved April 5, 2015.
- ↑ "Historical Census Browser". University of Virginia Library. Retrieved April 5, 2015.
- ↑ Forstall, Richard L., ed. (March 27, 1995). "Population of Counties by Decennial Census: 1900 to 1990". United States Census Bureau. Retrieved April 5, 2015.
- ↑ "Census 2000 PHC-T-4. Ranking Tables for Counties: 1990 and 2000" (PDF). United States Census Bureau. April 2, 2001. Retrieved April 5, 2015.
- ↑ Based on 2000 census data
- 1 2 "American FactFinder". United States Census Bureau. Retrieved 2011-05-14.
- ↑ Leip, David. "Dave Leip's Atlas of U.S. Presidential Elections". uselectionatlas.org. Retrieved 2018-03-10.
External links
| Wikimedia Commons has media related to Hardeman County, Tennessee. |
- Chamber of Commerce site
- Hardeman County, TNGenWeb - free genealogy resources for the county
- Hardeman County at Curlie (based on DMOZ)
- Hardeman County at Tennessee Encyclopedia of History and Culture
- Thomas Jones Hardeman at Handbook of Texas
- Thomas Jones Hardeman at Find a Grave
Places adjacent to Hardeman County, Tennessee | |
|---|---|
Municipalities and communities of Hardeman County, Tennessee, United States | ||
|---|---|---|
| Cities | ||
| Towns | ||
| Unincorporated communities | ||
| Footnotes | ‡This populated place also has portions in an adjacent county or counties | |