Hamblen County, Tennessee
| Hamblen County, Tennessee | |
|---|---|
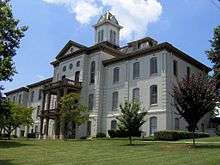 Hamblen County Courthouse in Morristown | |
|
Location in the U.S. state of Tennessee | |
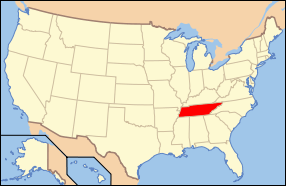 Tennessee's location in the U.S. | |
| Founded | 1870 |
| Named for | Hezekiah Hamblen[1] |
| Seat | Morristown |
| Largest city | Morristown |
| Area | |
| • Total | 176 sq mi (456 km2) |
| • Land | 161 sq mi (417 km2) |
| • Water | 15 sq mi (39 km2), 8.3% |
| Population | |
| • (2010) | 62,544 |
| • Density | 388/sq mi (150/km2) |
| Congressional district | 1st |
| Time zone | Eastern: UTC−5/−4 |
| Website |
www |
Hamblen County is a county located in the U.S. state of Tennessee. As of the 2010 census, the population was 62,544.[2] Its county seat and only Incorporated city is Morristown.[3]
Hamblen County is part of the Morristown, TN Metropolitan Statistical Area as well as the Knoxville-Morristown-Sevierville, TN Combined Statistical Area.[4]
History
Hamblen County was created in 1870 from parts of Jefferson, Grainger, and Greene counties. The county is named in honor of Hezekiah Hamblen (1775–1854),[1][5] an early settler, landowner, attorney, and member of the Hawkins County Court for many years. Governor Dewitt Clinton Senter, a resident of the county, used his influence to assist in its establishment.[6]
Geography
According to the U.S. Census Bureau, the county has a total area of 176 square miles (460 km2), of which 161 square miles (420 km2) is land and 15 square miles (39 km2) (8.3%) is water.[7] It is the third-smallest county in Tennessee by land area and fourth-smallest by total area.
Adjacent counties
- Hawkins County (northeast)
- Greene County (east)
- Cocke County (south)
- Jefferson County (southwest)
- Grainger County (northwest)
State protected areas
- Panther Creek State Park
- Rankin Wildlife Management Area (part)
Other historic sites
Major highways
Demographics
| Historical population | |||
|---|---|---|---|
| Census | Pop. | %± | |
| 1880 | 10,187 | — | |
| 1890 | 11,418 | 12.1% | |
| 1900 | 12,728 | 11.5% | |
| 1910 | 13,650 | 7.2% | |
| 1920 | 15,056 | 10.3% | |
| 1930 | 16,616 | 10.4% | |
| 1940 | 18,611 | 12.0% | |
| 1950 | 23,976 | 28.8% | |
| 1960 | 33,092 | 38.0% | |
| 1970 | 38,696 | 16.9% | |
| 1980 | 49,300 | 27.4% | |
| 1990 | 50,480 | 2.4% | |
| 2000 | 58,128 | 15.2% | |
| 2010 | 62,544 | 7.6% | |
| Est. 2016 | 63,785 | [8] | 2.0% |
| U.S. Decennial Census[9] 1790-1960[10] 1900-1990[11] 1990-2000[12] 2010-2014[2] | |||
As of the census[13] of 2010, there were 62,544 people, 29,693 households, and 17,161 families residing in the county. The population density was 388 people per square mile (138/km²). There were 24,560 housing units at an average density of 153 per square mile (59/km²). The racial makeup of the county was 84.2% White, 10.7% Hispanic or Latino, 4% Black or African American, 0.3% Native American, 0.7% Asian, and 0.1% Pacific Islander.
There were 24,560 households out of which 28.4% had children under the age of 18 living with them, 51.3% were married couples living together, 13.1% had a female householder with no husband present, and 30.1% were non-families. 25.70% of all households were made up of individuals living alone and 11.2% had someone living alone who was 65 years of age or older. The average household size was 2.51 and the average family size was 2.98.
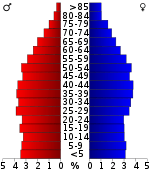
In the county, the population was spread out with 23.30% under the age of 20, 5.7% from 20 to 24, 25.7% from 25 to 44, 26.7% from 45 to 64, and 15.9% who were 65 years of age or older. The median age was 39.6 years. For every 100 females, there were 94.9 males. For every 100 females age 18 and over, there were 92.30 males.
The median income for a household in the county was $39,807, and the median income for a family was $48,353. Males had a median income of $36,166 versus $27,094 for females. The per capita income for the county was $21,162. 17.7% of the population and 13.2% of families were below the poverty line. Out of the total people living in poverty, 15.7% are under the age of 65 and 19.3% are 65 or older.
Communities
City
- Morristown (county seat)
Unincorporated communities
Politics
| Year | Republican | Democratic | Third Parties |
|---|---|---|---|
| 2016 | 76.6% 15,857 | 19.7% 4,075 | 3.7% 760 |
| 2012 | 72.5% 14,522 | 26.1% 5,234 | 1.4% 276 |
| 2008 | 68.4% 15,508 | 30.0% 6,807 | 1.6% 354 |
| 2004 | 66.1% 14,742 | 33.3% 7,433 | 0.6% 143 |
| 2000 | 60.0% 11,824 | 38.4% 7,564 | 1.6% 311 |
| 1996 | 54.1% 9,797 | 38.7% 7,006 | 7.2% 1,296 |
| 1992 | 49.8% 8,898 | 39.9% 7,114 | 10.3% 1,842 |
| 1988 | 66.9% 10,418 | 32.5% 5,061 | 0.6% 86 |
| 1984 | 69.0% 11,144 | 30.5% 4,922 | 0.6% 92 |
| 1980 | 60.6% 9,741 | 36.7% 5,890 | 2.8% 442 |
| 1976 | 47.8% 6,989 | 51.3% 7,504 | 0.9% 135 |
| 1972 | 76.4% 8,879 | 22.1% 2,563 | 1.6% 182 |
| 1968 | 57.9% 6,382 | 21.7% 2,390 | 20.5% 2,259 |
| 1964 | 53.0% 5,196 | 47.0% 4,607 | |
| 1960 | 69.2% 7,093 | 30.5% 3,122 | 0.3% 30 |
| 1956 | 67.8% 5,608 | 31.3% 2,592 | 0.9% 75 |
| 1952 | 67.2% 5,031 | 32.0% 2,395 | 0.8% 62 |
| 1948 | 53.8% 2,116 | 39.5% 1,552 | 6.7% 265 |
| 1944 | 53.7% 2,001 | 46.3% 1,723 | |
| 1940 | 46.3% 1,794 | 53.0% 2,055 | 0.7% 28 |
| 1936 | 48.1% 2,261 | 51.9% 2,438 | |
| 1932 | 41.4% 1,458 | 57.7% 2,032 | 0.9% 32 |
| 1928 | 60.1% 1,902 | 39.9% 1,263 | |
| 1924 | 49.5% 1,342 | 48.6% 1,317 | 2.0% 53 |
| 1920 | 53.9% 1,571 | 44.6% 1,301 | 1.5% 45 |
| 1916 | 50.7% 795 | 47.3% 741 | 2.0% 31 |
| 1912 | 28.6% 427 | 48.4% 722 | 23.0% 343 |
See also
References
- 1 2 Mrs. Burwin Haun, "Hamblen County," Tennessee Encyclopedia of History and Culture. Retrieved: 16 October 2013.
- 1 2 "State & County QuickFacts". United States Census Bureau. Archived from the original on July 11, 2011. Retrieved December 2, 2013.
- ↑ "Find a County". National Association of Counties. Retrieved 2011-06-07.
- ↑ "Revised Delineations of Metropolitan Statistical Areas, Micropolitan Statistical Areas, and Combined Statistical Areas, and Guidance on Uses of the Delineations of These Areas" (PDF). United States Census Bureau. Retrieved April 27, 2014.
- ↑ Gannett, Henry (1905). The Origin of Certain Place Names in the United States. Govt. Print. Off. p. 147.
- ↑ "Hamblen's History," Morristown Citizen Tribune, 12 September 2012. Retrieved: 16 October 2013.
- ↑ "2010 Census Gazetteer Files". United States Census Bureau. August 22, 2012. Retrieved April 5, 2015.
- ↑ "Population and Housing Unit Estimates". Retrieved June 9, 2017.
- ↑ "U.S. Decennial Census". United States Census Bureau. Retrieved April 5, 2015.
- ↑ "Historical Census Browser". University of Virginia Library. Retrieved April 5, 2015.
- ↑ Forstall, Richard L., ed. (March 27, 1995). "Population of Counties by Decennial Census: 1900 to 1990". United States Census Bureau. Retrieved April 5, 2015.
- ↑ "Census 2000 PHC-T-4. Ranking Tables for Counties: 1990 and 2000" (PDF). United States Census Bureau. April 2, 2001. Retrieved April 5, 2015.
- ↑ "American FactFinder". United States Census Bureau. Retrieved 2011-05-14.
- ↑ Leip, David. "Dave Leip's Atlas of U.S. Presidential Elections". uselectionatlas.org. Retrieved 2018-03-10.
External links
| Wikimedia Commons has media related to Hamblen County, Tennessee. |
- Official site
- Morristown Area Chamber of Commerce
- The Citizen Tribune, Morristown's newspaper
- Hamblen County Board of Education
- Hamblen County TNGenWeb site
- The Morristown-Hamblen Public Library website
- Hamblen County at Curlie (based on DMOZ)
Places adjacent to Hamblen County, Tennessee | ||||||||||
|---|---|---|---|---|---|---|---|---|---|---|
| ||||||||||
Municipalities and communities of Hamblen County, Tennessee, United States | ||
|---|---|---|
| City | ||
| Town | ||
| Unincorporated communities | ||
| Footnotes | ‡This populated place also has portions in an adjacent county or counties | |
| Principal City |   | |
|---|---|---|
| Other Cities | ||
| Counties | ||