Lake County, Tennessee
| Lake County, Tennessee | |
|---|---|
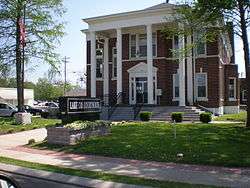 Lake County Courthouse in Tiptonville | |
|
Location in the U.S. state of Tennessee | |
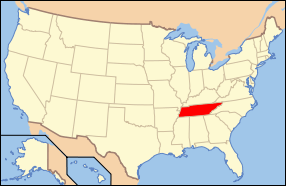 Tennessee's location in the U.S. | |
| Founded | 1870 |
| Named for | Reelfoot Lake[1] |
| Seat | Tiptonville |
| Largest town | Tiptonville |
| Area | |
| • Total | 194 sq mi (502 km2) |
| • Land | 166 sq mi (430 km2) |
| • Water | 28 sq mi (73 km2), 14% |
| Population | |
| • (2010) | 7,832 |
| • Density | 47/sq mi (18/km2) |
| Congressional district | 8th |
| Time zone | Central: UTC−6/−5 |
| Website |
www |
Lake County is a county located in the northwest corner of the U.S. state of Tennessee. As of the 2010 census, the population was 7,832,[2] making it the fifth-least populous county in Tennessee. Its county seat is Tiptonville.[3] It shares a border with Kentucky to the north and is separated from Missouri to the west by the Mississippi River.
Reelfoot Lake, formed after the Madrid earthquakes in the early 19th century, occupies much of the northern part of the county. Issues of control of the lake and the development of cotton plantations in this part of the county resulted in violence by local farmers against corporate owners in 1908; the state called in the militia to suppress night riding. Reelfoot Lake and surrounding property were finally acquired by the state beginning in 1914. It is now within the Reelfoot Lake State Park and preserved for public use.
History
The history of Lake County has been largely defined by Reelfoot Lake, a natural lake created by the New Madrid earthquakes of 1811 and 1812. It is surrounded by wetlands. This territory was originally included in Obion County.[1]
In 1862, during the Civil War, the Battle of Island Number Ten took place in the Mississippi River, just off the shores of Obion County, in territory now part of Lake County.[1]
The county was organized in 1870, during the Reconstruction era. Its residents had long complained about the difficulty of having to traverse swampy areas during seasonal high waters around Reelfoot Lake to reach the county seat, then Troy, Tennessee, located to the east of the lake. After the new Lake County was established, Tiptonville was designated as its county seat.
In 1907 and 1908, a violent conflict took place in Lake and Obion counties, and neighboring Fulton County, Kentucky, which also had frontage on the lake. Private investors bought title to most of the land around the lake, gaining control, and formed the West Tennessee Land Company, to develop the property. In this era, western Tennessee and Kentucky were being developed for cotton culture and the lowlands around the lake were fertile floodplain. They announced plans to drain the lake. A band of local farmers and others who made their living from the lake, organized resistance, becoming known as the "Night Riders of Reelfoot Lake."
Beginning with the burning of John Carlos Burdick's fish docks on April 12, 1908, they committed crimes over a period of months, harassing the land company's employees.[4] In October 1908 they kidnapped two attorneys and lynched one, Quentin Rankin, who was also a shareholder in the land company. The other escaped.[1] Given this attack and murder, Governor Malcolm Patterson personally led the Tennessee National Guard into the area, and arrested hundreds of suspected Night Riders.[5] The Night Riders also rode against African Americans, as they were resisting the increase of blacks in the counties, some of whom had come to work as sharecroppers on newly developed cotton plantations. Since the late 19th century, the white-dominated legislature had passed Jim Crow laws and increasing restrictions on voters.
The state gained title to Reelfoot Lake in 1914 to preserve it for public use, but actions were tied up for some years in court challenges.[5] To prevent private development from restricting its use, in 1925 Governor Austin Peay designated the lake as a hunting and fishing reserve. This was the precedent for the larger area to be preserved as the modern Reelfoot Lake State Park.[6]
From 1877–1950, there were 13 lynchings of blacks in Lake County, the third-highest number in the state. Neighboring Obion County had 18 lynchings. These were high rates for counties with relatively small populations; Shelby County had the highest total, 20 lynchings in that period. Most of these murders were committed in the decades around the turn of the century,[7] during the period of heightened violence related to opposition to corporate control of Reelfoot Lake and the introduction of cotton plantations and African-American workers to this area.[8]
Geography
According to the U.S. Census Bureau, the county has a total area of 194 square miles (500 km2), of which 166 square miles (430 km2) is land and 28 square miles (73 km2) (14%) is water.[9] It is the fifth-smallest county in Tennessee by area.
Adjacent counties
- Fulton County, Kentucky (north)
- Obion County (east)
- Dyer County (south)
- Pemiscot County, Missouri (west)
- New Madrid County, Missouri (northwest)
National protected areas
State protected areas
- Reelfoot Lake State Natural Area (part)
- Reelfoot Lake State Park (part)
- Tumbleweed Wildlife Management Area (part)
Demographics
From 1950 to 1990 the population declined noticeably, as many African Americans moved to cities or to the West Coast in the Great Migration of the second half of the 20th century.
| Historical population | |||
|---|---|---|---|
| Census | Pop. | %± | |
| 1870 | 2,428 | — | |
| 1880 | 3,968 | 63.4% | |
| 1890 | 5,304 | 33.7% | |
| 1900 | 7,368 | 38.9% | |
| 1910 | 8,704 | 18.1% | |
| 1920 | 9,075 | 4.3% | |
| 1930 | 10,486 | 15.5% | |
| 1940 | 11,235 | 7.1% | |
| 1950 | 11,655 | 3.7% | |
| 1960 | 9,572 | −17.9% | |
| 1970 | 7,896 | −17.5% | |
| 1980 | 7,455 | −5.6% | |
| 1990 | 7,129 | −4.4% | |
| 2000 | 7,954 | 11.6% | |
| 2010 | 7,832 | −1.5% | |
| Est. 2016 | 7,560 | [10] | −3.5% |
| U.S. Decennial Census[11] 1790–1960[12] 1900–1990[13] 1990–2000[14] 2010–2014[2] | |||
As of the census[16] of 2000, there were 7,954 people, 2,410 households, and 1,614 families residing in the county. The population density was 49 people per square mile (19/km²). There were 2,716 housing units at an average density of 17 per square mile (6/km²). The racial makeup of the county was 66.63% White, 31.19% Black or African American, 0.39% Native American, 0.14% Asian, 0.62% from other races, and 1.03% from two or more races. 1.37% of the population were Hispanic or Latino of any race.
There were 2,410 households out of which 28.80% had children under the age of 18 living with them, 47.20% were married couples living together, 16.30% had a female householder with no husband present, and 33.00% were non-families. 30.00% of all households were made up of individuals and 15.50% had someone living alone who was 65 years of age or older. The average household size was 2.36 and the average family size was 2.92.
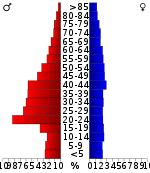
In the county, the population was spread out with 17.70% under the age of 18, 13.70% from 18 to 24, 33.80% from 25 to 44, 21.50% from 45 to 64, and 13.30% who were 65 years of age or older. The median age was 36 years. For every 100 females there were 151.00 males. For every 100 females age 18 and over, there were 163.40 males.
The median income for a household in the county was $21,995, and the median income for a family was $30,339. Males had a median income of $25,082 versus $18,700 for females. The per capita income for the county was $10,794. About 19.90% of families and 23.60% of the population were below the poverty line, including 35.10% of those under age 18 and 25.10% of those age 65 or over.
Media
Radio stations
- WTNV FM 97.3
- KMIS-AM 1050
Newspaper
- The Lake County Banner [17]
Education
- Lake County High School (9–12)
- Lara Kendall Elementary School (K–8)
- Margaret Newton Elementary School (K–6)
Communities
Towns
- Ridgely
- Tiptonville (county seat)
Unincorporated communities
Politics
| Year | Republican | Democratic | Third Parties |
|---|---|---|---|
| 2016 | 68.9% 1,357 | 29.3% 577 | 1.8% 36 |
| 2012 | 55.7% 1,163 | 42.4% 884 | 1.9% 40 |
| 2008 | 52.5% 1,175 | 45.8% 1,024 | 1.7% 39 |
| 2004 | 43.8% 1,039 | 55.6% 1,317 | 0.6% 14 |
| 2000 | 35.1% 781 | 63.8% 1,419 | 1.1% 24 |
| 1996 | 29.7% 589 | 64.2% 1,273 | 6.1% 120 |
| 1992 | 29.5% 680 | 62.8% 1,449 | 7.7% 177 |
| 1988 | 46.1% 806 | 53.4% 935 | 0.5% 9 |
| 1984 | 42.0% 878 | 56.9% 1,191 | 1.1% 23 |
| 1980 | 32.1% 823 | 67.0% 1,718 | 0.9% 22 |
| 1976 | 23.2% 591 | 75.8% 1,933 | 1.0% 25 |
| 1972 | 65.7% 1,147 | 30.7% 536 | 3.6% 63 |
| 1968 | 17.0% 409 | 30.6% 737 | 52.4% 1,262 |
| 1964 | 30.6% 736 | 69.4% 1,667 | |
| 1960 | 34.0% 732 | 62.6% 1,346 | 3.4% 73 |
| 1956 | 22.8% 512 | 74.5% 1,673 | 2.7% 61 |
| 1952 | 24.7% 487 | 74.7% 1,475 | 0.7% 13 |
| 1948 | 11.9% 179 | 55.5% 833 | 32.6% 490 |
| 1944 | 9.4% 150 | 90.6% 1,440 | |
| 1940 | 6.7% 213 | 92.9% 2,962 | 0.4% 12 |
| 1936 | 3.0% 113 | 96.9% 3,604 | 0.1% 3 |
| 1932 | 4.1% 78 | 95.9% 1,824 | |
| 1928 | 14.7% 166 | 85.3% 960 | |
| 1924 | 9.5% 87 | 89.5% 817 | 1.0% 9 |
| 1920 | 22.7% 352 | 76.8% 1,192 | 0.5% 8 |
| 1916 | 15.0% 130 | 83.7% 727 | 1.4% 12 |
| 1912 | 18.4% 122 | 75.0% 499 | 6.6% 44 |
See also
References
- 1 2 3 4 Abigail Hyde, "Lake County," Tennessee Encyclopedia of History and Culture. Retrieved: 21 October 2013.
- 1 2 "State & County QuickFacts". United States Census Bureau. Archived from the original on July 13, 2011. Retrieved December 3, 2013.
- ↑ "Find a County". National Association of Counties. Retrieved 2011-06-07.
- ↑ Grove, Uneasy Waters (2012, p. 7
- 1 2 Bill Threlkeld, "Night Riders of Reelfoot Lake," Tennessee Encyclopedia of History and Culture. Retrieved: 21 October 2013.
- ↑ Phillip Langsdon, Tennessee: A Political History (Franklin, Tenn.: Hillsboro Press, 2000), pp. 303–309.
- ↑ Lynching in America/ Supplement: Lynchings by County, Equal Justice Initiative, 2015, p. 6
- ↑ Jama McMurtery Grove, "Uneasy Waters: The Night Riders at Reelfoot Lake, Tennessee, 1908"], East Tennessee University, 2012; Electronic Theses and Dissertations. Paper 1496. http://dc.etsu.edu etd/1496
- ↑ "2010 Census Gazetteer Files". United States Census Bureau. August 22, 2012. Retrieved April 7, 2015.
- ↑ "Population and Housing Unit Estimates". Retrieved June 9, 2017.
- ↑ "U.S. Decennial Census". United States Census Bureau. Retrieved April 7, 2015.
- ↑ "Historical Census Browser". University of Virginia Library. Retrieved April 7, 2015.
- ↑ Forstall, Richard L., ed. (March 27, 1995). "Population of Counties by Decennial Census: 1900 to 1990". United States Census Bureau. Retrieved April 7, 2015.
- ↑ "Census 2000 PHC-T-4. Ranking Tables for Counties: 1990 and 2000" (PDF). United States Census Bureau. April 2, 2001. Retrieved April 7, 2015.
- ↑ Based on 2000 census data
- ↑ "American FactFinder". United States Census Bureau. Retrieved 2011-05-14.
- ↑ Lake County Banner website. Retrieved: 21 October 2013.
- ↑ Leip, David. "Dave Leip's Atlas of U.S. Presidential Elections". uselectionatlas.org. Retrieved 2018-03-11.
External links
| Wikimedia Commons has media related to Lake County, Tennessee. |
- Reelfoot Chamber of Commerce
- Lake County, TNGenWeb – free genealogy resources for the county
- Lake County at Curlie (based on DMOZ)
Places adjacent to Lake County, Tennessee | ||||||||||
|---|---|---|---|---|---|---|---|---|---|---|
| ||||||||||
Municipalities and communities of Lake County, Tennessee, United States | ||
|---|---|---|
| Towns | ||
| Unincorporated communities | ||