Stewart County, Tennessee
| Stewart County, Tennessee | |
|---|---|
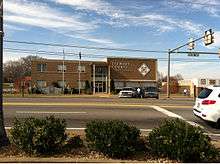 Stewart County courthouse | |
|
Location in the U.S. state of Tennessee | |
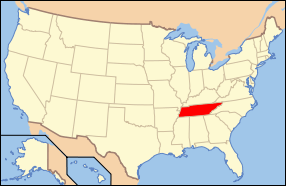 Tennessee's location in the U.S. | |
| Founded | 1803 |
| Named for | Duncan Stewart[1] |
| Seat | Dover |
| Largest city | Dover |
| Area | |
| • Total | 493 sq mi (1,277 km2) |
| • Land | 459 sq mi (1,189 km2) |
| • Water | 34 sq mi (88 km2), 6.8% |
| Population | |
| • (2010) | 13,324 |
| • Density | 29/sq mi (11/km2) |
| Congressional district | 7th |
| Time zone | Central: UTC−6/−5 |
| Website |
www |
Stewart County is a county located in the U.S. state of Tennessee. As of the 2010 census, the population was 13,324.[2] Its county seat is Dover.[3]
Stewart County is home to Stewart Prince, the site of a Confederate stand against the Union's push up the Cumberland River during the Civil War.
Stewart County is part of the Clarksville Metropolitan Statistical Area.
History
Stewart County was created in 1803 from a portion of Montgomery County, and was named for Duncan Stewart, an early settler and state legislator.[1] During the Battle of Fort Donelson, the county seat, Dover, was burned by Union troops to prevent its capture by General Nathan B. Forrest.[1]
Tobaccoport Saltpeter Cave was intensely mined for saltpeter, possibly during the War of 1812. Saltpeter is the main ingredient of gunpowder and was obtained by leaching the earth from the cave. This area fell under Union control in February 1862, early in the Civil War, and it seems unlikely that mining could have happened before that.[4]
Geography
.jpg)
According to the U.S. Census Bureau, the county has a total area of 493 square miles (1,280 km2), of which 459 square miles (1,190 km2) is land and 34 square miles (88 km2) (6.8%) is water.[5] The county lies in a rugged section of the northwestern Highland Rim. The Cumberland River (part of Lake Barkley) traverses the county. The Tennessee River (part of Kentucky Lake) provides the county's border with Henry County to the west.
Federal and state agencies control nearly 44% of the land in the county.[1]
Adjacent counties
- Trigg County, Kentucky (north)
- Christian County, Kentucky (northeast)
- Montgomery County (east)
- Houston County (south)
- Benton County (southwest)
- Henry County (west)
- Calloway County, Kentucky (northwest)
National protected areas
State protected areas
- Barkley Wildlife Management Area
- Stewart State Forest
Demographics
| Historical population | |||
|---|---|---|---|
| Census | Pop. | %± | |
| 1810 | 4,262 | — | |
| 1820 | 8,397 | 97.0% | |
| 1830 | 6,968 | −17.0% | |
| 1840 | 8,587 | 23.2% | |
| 1850 | 9,719 | 13.2% | |
| 1860 | 9,896 | 1.8% | |
| 1870 | 12,019 | 21.5% | |
| 1880 | 12,690 | 5.6% | |
| 1890 | 12,193 | −3.9% | |
| 1900 | 15,224 | 24.9% | |
| 1910 | 14,860 | −2.4% | |
| 1920 | 14,664 | −1.3% | |
| 1930 | 13,278 | −9.5% | |
| 1940 | 13,549 | 2.0% | |
| 1950 | 9,175 | −32.3% | |
| 1960 | 7,851 | −14.4% | |
| 1970 | 7,319 | −6.8% | |
| 1980 | 8,665 | 18.4% | |
| 1990 | 9,479 | 9.4% | |
| 2000 | 12,370 | 30.5% | |
| 2010 | 13,324 | 7.7% | |
| Est. 2016 | 13,182 | [6] | −1.1% |
| U.S. Decennial Census[7] 1790-1960[8] 1900-1990[9] 1990-2000[10] 2010-2014[2] | |||
As of the census[12] of 2000, there were 12,370 people, 4,930 households, and 3,653 families residing in the county. The population density was 27 people per square mile (10/km²). There were 5,977 housing units at an average density of 13 per square mile (5/km²). The racial makeup of the county was 95.27% White, 1.29% Black or African American, 0.61% Native American, 1.46% Asian, 0.05% Pacific Islander, 0.23% from other races, and 1.10% from two or more races. 1.00% of the population were Hispanic or Latino of any race.
There were 4,930 households out of which 31.50% had children under the age of 18 living with them, 62.30% were married couples living together, 8.10% had a female householder with no husband present, and 25.90% were non-families. 23.10% of all households were made up of individuals and 10.80% had someone living alone who was 65 years of age or older. The average household size was 2.49 and the average family size was 2.91.
In the county, the population was spread out with 23.90% under the age of 18, 7.50% from 18 to 24, 28.40% from 25 to 44, 25.40% from 45 to 64, and 14.90% who were 65 years of age or older. The median age was 39 years. For every 100 females, there were 99.10 males. For every 100 females age 18 and over, there were 96.50 males.
The median income for a household in the county was $32,316, and the median income for a family was $38,655. Males had a median income of $31,106 versus $21,985 for females. The per capita income for the county was $16,302. About 10.60% of families and 12.40% of the population were below the poverty line, including 12.90% of those under age 18 and 15.60% of those age 65 or over.
Politics
| Year | Republican | Democratic | Third Parties |
|---|---|---|---|
| 2016 | 72.9% 3,864 | 23.1% 1,222 | 4.0% 213 |
| 2012 | 57.9% 2,963 | 40.5% 2,069 | 1.6% 83 |
| 2008 | 53.7% 2,956 | 44.9% 2,470 | 1.5% 81 |
| 2004 | 47.9% 2,675 | 51.2% 2,860 | 0.9% 48 |
| 2000 | 38.2% 1,826 | 60.0% 2,870 | 1.8% 86 |
| 1996 | 27.8% 1,306 | 63.0% 2,962 | 9.2% 432 |
| 1992 | 24.2% 1,046 | 64.3% 2,779 | 11.5% 498 |
| 1988 | 39.5% 1,302 | 60.0% 1,979 | 0.5% 15 |
| 1984 | 36.8% 1,285 | 62.3% 2,174 | 0.9% 31 |
| 1980 | 29.7% 985 | 68.5% 2,274 | 1.8% 59 |
| 1976 | 17.2% 510 | 82.2% 2,442 | 0.7% 20 |
| 1972 | 40.8% 790 | 56.7% 1,098 | 2.4% 47 |
| 1968 | 17.4% 443 | 41.0% 1,041 | 41.6% 1,057 |
| 1964 | 15.3% 441 | 84.7% 2,444 | |
| 1960 | 22.6% 539 | 75.9% 1,810 | 1.6% 37 |
| 1956 | 20.8% 560 | 78.6% 2,120 | 0.6% 16 |
| 1952 | 22.7% 641 | 76.9% 2,170 | 0.4% 12 |
| 1948 | 13.7% 331 | 81.4% 1,962 | 4.9% 118 |
| 1944 | 14.9% 335 | 85.1% 1,916 | |
| 1940 | 12.1% 374 | 87.4% 2,699 | 0.5% 15 |
| 1936 | 14.9% 303 | 84.7% 1,718 | 0.4% 7 |
| 1932 | 10.6% 184 | 88.8% 1,548 | 0.7% 12 |
| 1928 | 24.2% 401 | 75.8% 1,255 | |
| 1924 | 15.9% 264 | 82.6% 1,369 | 1.5% 25 |
| 1920 | 26.2% 849 | 72.9% 2,366 | 0.9% 29 |
| 1916 | 25.3% 591 | 73.1% 1,711 | 1.6% 38 |
| 1912 | 23.7% 485 | 64.1% 1,312 | 12.3% 251 |
The county is part of Tennessee's 8th congressional district, and traditionally voted Democratic as it was powerfully secessionist. In fact, before 1972 no Republican had ever won thirty percent of Stewart County’s vote, and up to 2000 Richard Nixon in his 3,000-plus-county landslide of 1972 was the only GOP candidate to reach forty percent. The solitary time before 2000 when a Democratic candidate lost Stewart County was the 1968 win by George Wallace of the American Independent Party, following which it became one of only six Wallace counties[lower-alpha 1] to support George McGovern.
However, Stewart County has rapidly trended Republican in recent presidential elections, due to opposition to the Democratic Party’s liberal views on social issues.[14] In the 2008 presidential election, John McCain received approximately 53.7% of the vote,[15] making him the first Republican to carry the county. Stewart County was the sole county in Tennessee that had never voted for a Republican presidential candidate in the last 100 years.[16] In 2016, Donald Trump continued this rapid GOP trend, gaining a proportion only marginally less than the GOP gained in historically Unionist counties of East Tennessee and the Highland Rim.
Media
Radio stations
- WTPR-FM 101.7 - "The Greatest Hits of All Time"
- WTPR-AM 710 - "The Greatest Hits of All Time"
- WAKQ-FM 105.5 - "Today's Best Music with Ace & TJ in the Morning"
Communities
City
- Dover (county seat)
Towns
- Cumberland City
- Tennessee Ridge (mostly in Houston County)
Unincorporated communities
See also
Notes
- ↑ The others were the fellow secessionist white-majority Middle Tennessee counties of Houston and Perry, plus the three Alabama Black Belt counties of Bullock, Lowndes and Wilcox where Negro voter registration was severely delayed after the Voting Rights Act.
References
- 1 2 3 4 Jane Bagwell, "Stewart County," Tennessee Encyclopedia of History and Culture. Retrieved: 7 April 2013.
- 1 2 "State & County QuickFacts". United States Census Bureau. Retrieved December 7, 2013.
- ↑ "Find a County". National Association of Counties. Archived from the original on May 31, 2011. Retrieved 2011-06-07.
- ↑ Thomas C. Barr, Jr., "Caves of Tennessee", Bulletin 64 of the Tennessee Division of Geology, 1961, 568 pages.
- ↑ "2010 Census Gazetteer Files". United States Census Bureau. August 22, 2012. Retrieved April 14, 2015.
- ↑ "Population and Housing Unit Estimates". Retrieved June 9, 2017.
- ↑ "U.S. Decennial Census". United States Census Bureau. Archived from the original on May 12, 2015. Retrieved April 14, 2015.
- ↑ "Historical Census Browser". University of Virginia Library. Retrieved April 14, 2015.
- ↑ Forstall, Richard L., ed. (March 27, 1995). "Population of Counties by Decennial Census: 1900 to 1990". United States Census Bureau. Retrieved April 14, 2015.
- ↑ "Census 2000 PHC-T-4. Ranking Tables for Counties: 1990 and 2000" (PDF). United States Census Bureau. April 2, 2001. Retrieved April 14, 2015.
- ↑ Based on 2000 census data
- ↑ "American FactFinder". United States Census Bureau. Archived from the original on September 11, 2013. Retrieved 2011-05-14.
- ↑ Leip, David. "Dave Leip's Atlas of U.S. Presidential Elections". uselectionatlas.org. Retrieved 2018-03-12.
- ↑ Cohn, Nate; ‘Demographic Shift: Southern Whites’ Loyalty to G.O.P. Nearing That of Blacks to Democrats’, New York Times, April 24, 2014
- ↑ 2008 electoral map, New York Times, 9 December 2008. Retrieved: 7 April 2013.
- ↑ David Leip, "Presidential General Election Map Comparison (Tennessee)," Atlas of U.S. Presidential Elections. Retrieved: 7 April 2013.
External links
| Wikimedia Commons has media related to Stewart County, Tennessee. |
- Official website
- Stewart County Chamber of Commerce
- Stewart County Schools
- TNGenWeb
- Stewart County at Curlie (based on DMOZ)
Places adjacent to Stewart County, Tennessee | |
|---|---|
Municipalities and communities of Stewart County, Tennessee, United States | ||
|---|---|---|
| City | ||
| Towns | ||
| Unincorporated communities | ||
| Ghost town | ||
| Footnotes | ‡This populated place also has portions in an adjacent county or counties | |