Johnson County, Tennessee
| Johnson County, Tennessee | |
|---|---|
 Johnson County Courthouse in Mountain City | |
|
Location in the U.S. state of Tennessee | |
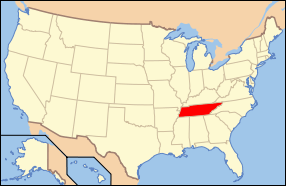 Tennessee's location in the U.S. | |
| Founded | 1836 |
| Named for | Thomas Johnson, early settler[1] |
| Seat | Mountain City |
| Largest town | Mountain City |
| Area | |
| • Total | 303 sq mi (785 km2) |
| • Land | 298 sq mi (772 km2) |
| • Water | 4.2 sq mi (11 km2), 1.4% |
| Population | |
| • (2010) | 18,244 |
| • Density | 61/sq mi (24/km2) |
| Congressional district | 1st |
| Time zone | Eastern: UTC−5/−4 |
Johnson County is a county located in the U.S. state of Tennessee. As of the 2010 census, the population was 18,244.[2] Its county seat is Mountain City.[3] It is the state's northeasternmost county, sharing borders with Virginia and North Carolina.
History
Johnson County was created in 1836 from parts of Carter County. This followed several years of bickering over the location of Carter County's seat, with residents of what is now Johnson County arguing that travel to Elizabethton was too lengthy and difficult. When their petition to move the seat to a more central location was rejected, they petitioned the state legislature for the creation of a new county. The new county was named after Thomas Johnson, an early settler. The county seat was initially named "Taylorsville" in honor of Colonel James P. Taylor (it was changed to "Mountain City" in the 1880s).[1][4]
Most Johnson Countians supported the Union during the Civil War. The county's residents rejected secession by a margin of 788 to 111 in Tennessee's secession referendum on June 8, 1861.[5] The county sent a sizable delegation to the Greeneville session of the pro-Union East Tennessee Convention in June 1861.[6]
Due in large part to the county's remoteness, the railroads did not reach Johnson until the early 1900s. The arrival of the railroads during this period aided the development of the timber and manganese mining industries.[1]
Geography

According to the U.S. Census Bureau, the county has a total area of 303 square miles (780 km2), of which 298 square miles (770 km2) is land and 4.2 square miles (11 km2) (1.4%) is water.[7]
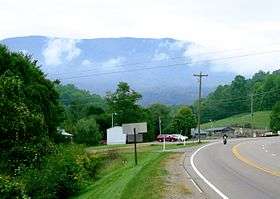
Situated entirely within the Blue Ridge Mountains,[8] Johnson County is relatively rugged and hilly. The county's boundary with Sullivan County to the northwest is defined as the ridgeline of Holston Mountain, while the Iron Mountains provide the county's boundary with Carter County to the southwest. Snake Mountain, at 5,574 feet (1,699 m), is the county's highest point.[1]
High elevation
In terms of average elevation, Johnson County is one of the highest counties (if not the highest) in Tennessee. The county is home to the two highest communities in the state: Trade, at 3,133 feet (955 m), and Shady Valley, at 2,785 feet (849 m). Mountain City is the highest incorporated city in Tennessee, at 2,418 feet (737 m). The lowest point in the county is Watauga Lake, at an elevation of 1,959 feet (597 m).
Lakes
Adjacent counties
- Washington County, Virginia (north)
- Grayson County, Virginia (northeast)
- Ashe County, North Carolina (east)
- Watauga County, North Carolina (southeast)
- Avery County, North Carolina (south)
- Carter County (southwest)
- Sullivan County (west)
National protected areas
- Appalachian Trail (part)
- Cherokee National Forest (part)
Demographics
| Historical population | |||
|---|---|---|---|
| Census | Pop. | %± | |
| 1840 | 2,658 | — | |
| 1850 | 3,705 | 39.4% | |
| 1860 | 5,018 | 35.4% | |
| 1870 | 5,852 | 16.6% | |
| 1880 | 7,766 | 32.7% | |
| 1890 | 8,858 | 14.1% | |
| 1900 | 10,589 | 19.5% | |
| 1910 | 13,191 | 24.6% | |
| 1920 | 12,230 | −7.3% | |
| 1930 | 12,209 | −0.2% | |
| 1940 | 12,998 | 6.5% | |
| 1950 | 12,278 | −5.5% | |
| 1960 | 10,765 | −12.3% | |
| 1970 | 11,569 | 7.5% | |
| 1980 | 13,745 | 18.8% | |
| 1990 | 13,766 | 0.2% | |
| 2000 | 17,499 | 27.1% | |
| 2010 | 18,244 | 4.3% | |
| Est. 2016 | 17,754 | [9] | −2.7% |
| U.S. Decennial Census[10] 1790-1960[11] 1900-1990[12] 1990-2000[13] 2010-2014[2] | |||

As of the census[15] of 2000, there were 17,499 people, 6,827 households, and 4,751 families residing in the county. The population density was 59 people per square mile (23/km²). There were 7,879 housing units at an average density of 26 per square mile (10/km²). The racial makeup of the county was 96.40% White, 2.42% Black or African American, 0.34% Native American, 0.12% Asian, 0.02% Pacific Islander, 0.23% from other races, and 0.46% from two or more races. 0.86% of the population were Hispanic or Latino of any race.
There were 6,827 households out of which 26.40% had children under the age of 18 living with them, 55.40% were married couples living together, 10.00% had a female householder with no husband present, and 30.40% were non-families. 26.40% of all households were made up of individuals and 11.50% had someone living alone who was 65 years of age or older. The average household size was 2.35 and the average family size was 2.81.
In the county, the population was spread out with 19.70% under the age of 18, 7.40% from 18 to 24, 30.80% from 25 to 44, 27.10% from 45 to 64, and 15.00% who were 65 years of age or older. The median age was 40 years. For every 100 females there were 114.60 males. For every 100 females age 18 and over, there were 114.40 males.
The median income for a household in the county was $23,067, and the median income for a family was $28,400. Males had a median income of $24,018 versus $18,817 for females. The per capita income for the county was $13,388. About 18.70% of families and 22.60% of the population were below the poverty line, including 26.80% of those under age 18 and 21.50% of those age 65 or over.
Male inmates in the Northeast Correctional Complex, southwest of Mountain City, account for 1,299 (7.4%) of the county's population.[16]
Politics
| Year | Republican | Democratic | Third Parties |
|---|---|---|---|
| 2016 | 82.2% 5,410 | 15.0% 988 | 2.8% 181 |
| 2012 | 74.4% 4,611 | 23.9% 1,483 | 1.6% 100 |
| 2008 | 70.1% 4,621 | 27.9% 1,837 | 2.0% 133 |
| 2004 | 71.5% 4,634 | 28.0% 1,812 | 0.5% 34 |
| 2000 | 66.1% 3,740 | 32.1% 1,813 | 1.8% 104 |
| 1996 | 58.5% 3,137 | 31.7% 1,698 | 9.8% 524 |
| 1992 | 57.0% 3,170 | 32.0% 1,781 | 11.0% 612 |
| 1988 | 73.1% 3,715 | 26.2% 1,329 | 0.7% 35 |
| 1984 | 79.1% 3,853 | 20.5% 999 | 0.4% 19 |
| 1980 | 75.0% 3,716 | 23.0% 1,141 | 2.0% 98 |
| 1976 | 66.7% 2,986 | 32.7% 1,464 | 0.6% 28 |
| 1972 | 87.1% 3,362 | 11.7% 450 | 1.3% 49 |
| 1968 | 79.0% 3,107 | 11.4% 450 | 9.5% 375 |
| 1964 | 75.7% 2,889 | 24.3% 927 | |
| 1960 | 86.7% 3,854 | 12.9% 571 | 0.4% 18 |
| 1956 | 87.4% 3,690 | 11.9% 503 | 0.6% 27 |
| 1952 | 87.7% 3,590 | 12.4% 506 | |
| 1948 | 83.0% 2,413 | 14.9% 433 | 2.1% 62 |
| 1944 | 85.5% 2,699 | 14.3% 450 | 0.3% 9 |
| 1940 | 84.2% 2,502 | 15.8% 469 | |
| 1936 | 84.4% 2,882 | 15.6% 533 | |
| 1932 | 84.5% 2,400 | 15.0% 425 | 0.5% 15 |
| 1928 | 94.0% 3,057 | 6.0% 196 | |
| 1924 | 91.4% 2,799 | 8.3% 254 | 0.4% 11 |
| 1920 | 92.6% 3,627 | 7.4% 291 | |
| 1916 | 87.3% 1,812 | 12.7% 263 | |
| 1912 | 42.1% 933 | 11.6% 256 | 46.3% 1,025 |
The county is historically Republican and is located within Tennessee's 1st congressional district, which has not been represented by a Democrat in over 120 years.
The county has never been carried by a Democratic presidential candidate. It reportedly was the strongest county for Calvin Coolidge in 1924,[18] Herbert Hoover in 1932[19] and Alf Landon in 1936.[20] The Republican candidate has continued to consistently win since 1956.[21][22] Since 1992 no Republican candidate has received less than 57% of the county's vote and in 2008 John McCain received 70.1%.[23]
Communities


Town
- Mountain City (county seat)
Unincorporated communities
- Butler
- Dewey
- Doe Valley
- Doeville
- Crandull
- Laurel Bloomery
- Maymead
- Midway
- Neva
- Pandora
- Shady Valley
- Sutherland
- Trade
See also
- National Register of Historic Places listings in Johnson County, Tennessee
- RedTail Mountain Resort, a luxury inn and country club in Mountain City
- North Carolina–Tennessee–Virginia Corners
References
- 1 2 3 4 Jewell Hamm, "Johnson County," Tennessee Encyclopedia of History and Culture. Retrieved: 18 October 2013.
- 1 2 "State & County QuickFacts". United States Census Bureau. Archived from the original on July 12, 2011. Retrieved December 3, 2013.
- ↑ "Find a County". National Association of Counties. Archived from the original on 2011-05-31. Retrieved 2011-06-07.
- ↑ "The Forming of Johnson County," Mountain City Elementary School website. Retrieved: 28 September 2015.
- ↑ Oliver Perry Temple, East Tennessee and the Civil War (R. Clarke Company, 1899), p. 199.
- ↑ Charles F. Bryan, Jr., "A Gathering of Tories: The East Tennessee Conventions of 1861," Tennessee Historical Quarterly, Vol. 39, No. 1 (Spring 1980), pp. 27-48.
- ↑ "2010 Census Gazetteer Files". United States Census Bureau. August 22, 2012. Retrieved April 7, 2015.
- ↑ Tennessee Department of Environment and Conservation, et al., "Ambient Air Monitoring Plan," Environmental Protection Agency website, 1 July 2010. Accessed: 18 March 2015.
- ↑ "Population and Housing Unit Estimates". Retrieved June 9, 2017.
- ↑ "U.S. Decennial Census". United States Census Bureau. Archived from the original on May 12, 2015. Retrieved April 7, 2015.
- ↑ "Historical Census Browser". University of Virginia Library. Retrieved April 7, 2015.
- ↑ Forstall, Richard L., ed. (March 27, 1995). "Population of Counties by Decennial Census: 1900 to 1990". United States Census Bureau. Retrieved April 7, 2015.
- ↑ "Census 2000 PHC-T-4. Ranking Tables for Counties: 1990 and 2000" (PDF). United States Census Bureau. April 2, 2001. Retrieved April 7, 2015.
- ↑ Based on 2000 census data
- ↑ "American FactFinder". United States Census Bureau. Retrieved 2011-05-14.
- ↑ Census Bureau Data Sets The Correctional Complex comprises census block 1020, block group 1, census tract 9561. Use table P37 on the SF 1 data set.
- ↑ Leip, David. "Dave Leip's Atlas of U.S. Presidential Elections". uselectionatlas.org. Retrieved 2018-03-11.
- ↑ David Leip's Presidential Atlas: Statistics for 1924
- ↑ David Leip's Presidential Atlas: Statistics for 1932
- ↑ David Leip's Presidential Atlas: Statistics for 1936
- ↑ David Leip's Presidential Atlas: Statistics for 1956
- ↑ David Leip's Presidential Election Atlas (Election maps for Tennessee)
- ↑ The New York Times electoral map (Zoom in on Tennessee)
External links
| Wikimedia Commons has media related to Johnson County, Tennessee. |
- Johnson County Chamber of Commerce
- Johnson County Schools
- Johnson County at Curlie (based on DMOZ)
Places adjacent to Johnson County, Tennessee | |
|---|---|
Municipalities and communities of Johnson County, Tennessee, United States | ||
|---|---|---|
| Town | ||
| Unincorporated communities | ||