Delaware County, Oklahoma
| Delaware County, Oklahoma | |
|---|---|
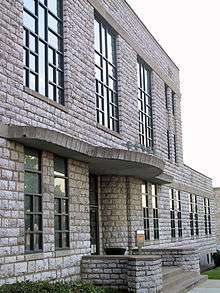 Delaware County Courthouse | |
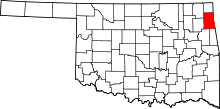 Location in the U.S. state of Oklahoma | |
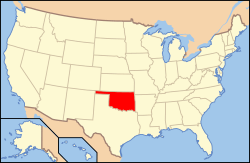 Oklahoma's location in the U.S. | |
| Founded | 1907 |
| Seat | Jay |
| Largest city | Grove |
| Area | |
| • Total | 792 sq mi (2,051 km2) |
| • Land | 738 sq mi (1,911 km2) |
| • Water | 54 sq mi (140 km2), 6.8% |
| Population (est.) | |
| • (2013) | 41,377 |
| • Density | 56/sq mi (22/km2) |
| Congressional district | 2nd |
| Time zone | Central: UTC−6/−5 |
Delaware County is a county located in the U.S. state of Oklahoma. As of the 2010 census, the population was 41,487.[1] Its county seat is Jay.[2] The county was named for the Delaware Indians who had established a village in the area prior to the arrival of the Cherokees in Indian Territory in the 1830s.
Delaware County was created in 1907. Prior to becoming Delaware County, a large portion of the area was known as the Delaware District of the Cherokee Nation. Today, Delaware County continues to be recognized by the Cherokee Nation as the Delaware District.
History
Archaeological studies have shown that at least three different periods of prehistoric people had lived in the area covered by Delaware County. These included 23 Archaic, 17 Woodland, and 63 Eastern Villager sites. Artifacts date back between 1400 and 2000 years from the present. Many of these sites have been submerged since the creation of Grand Lake o' the Cherokees.[3]
Few Native Americans lived in the area until the early nineteenth century, when the federal government began relocating tribes from the Eastern United States. About 1820, a group of Delaware, who had allied with the Cherokee against the Osage, settled Delaware Town, about two miles south of the present town of Eucha. In 1828, the Western Cherokee moved from Arkansas Territory into the area just south of the present Delaware County. In 1832, the Seneca moved from Ohio into an area that included the northeastern part of Delaware County.[3]
The present day county was created at statehood in 1907. Initially, Grove, the only incorporated town in the county, was designated as the county seat. However, a large number of county residents wanted a more centrally located seat. This group founded the town of Jay, where they built a wooden courthouse and won an election to move the county seat. A court suit resolved the dispute in favor of the Jay location.[3]
Geography
According to the U.S. Census Bureau, the county has a total area of 792 square miles (2,050 km2), of which 738 square miles (1,910 km2) is land and 54 square miles (140 km2) (6.8%) is water.[4] The county lies on the western slope of the Ozark Plateau. There are no oil, gas or mineral resources of economic consequence, but the county has abundant water.[3]
Lake Eucha, a man-made reservoir on Spavinaw Creek, completed in 1952, lies primarily within Delaware County. Grand Lake o' the Cherokees, completed in 1940, and Lake Spavinaw, completed in 1924, are partly within Delaware County. The Grand River and the Elk River drain the northern part of the county, while Flint Creek and the Illinois River drain the southern part.[3]
Major highways
Adjacent counties
- Ottawa County (north)
- McDonald County, Missouri northeast)
- Benton County, Arkansas (east)
- Adair County (south)
- Cherokee County (south)
- Mayes County (west)
- Craig County (northwest)
Demographics
| Historical population | |||
|---|---|---|---|
| Census | Pop. | %± | |
| 1910 | 11,469 | — | |
| 1920 | 13,868 | 20.9% | |
| 1930 | 15,370 | 10.8% | |
| 1940 | 18,592 | 21.0% | |
| 1950 | 14,734 | −20.8% | |
| 1960 | 13,198 | −10.4% | |
| 1970 | 17,767 | 34.6% | |
| 1980 | 23,946 | 34.8% | |
| 1990 | 28,070 | 17.2% | |
| 2000 | 37,077 | 32.1% | |
| 2010 | 41,487 | 11.9% | |
| Est. 2017 | 42,602 | [5] | 2.7% |
| U.S. Decennial Census[6] 1790-1960[7] 1900-1990[8] 1990-2000[9] 2010-2013[1] | |||
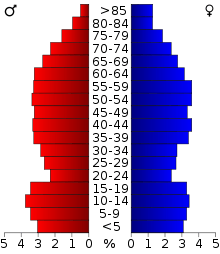
As of the 2010 census, there were 41,487 people, up from 37,077 people in 2000. In 2000, there were 14,838 households, and 10,772 families residing in the county. The population density was 50 people per square mile (19/km²). There were 22,290 housing units at an average density of 30 per square mile (12/km²). The racial makeup of the county was 70.22% White, 0.13% Black or African American, 22.31% Native American, 0.17% Asian, 0.04% Pacific Islander, 0.59% from other races, and 6.53% from two or more races. Self-identified Hispanic or Latino Americans made up 1.75% of the population. 93.8% spoke English, 3.5% Cherokee and 2.3% Spanish as their first language.
There were 14,838 households out of which 29.00% had children under the age of 18 living with them, 59.50% were married couples living together, 8.90% had a female householder with no husband present, and 27.40% were non-families. 24.00% of all households were made up of individuals and 11.20% had someone living alone who was 65 years of age or older. The average household size was 2.46 and the average family size was 2.89.
In the county, the population was spread out with 24.50% under the age of 18, 6.90% from 18 to 24, 24.40% from 25 to 44, 26.70% from 45 to 64, and 17.50% who were 65 years of age or older. The median age was 41 years. For every 100 females there were 96.50 males. For every 100 females age 18 and over, there were 93.80 males.
The median income for a household in the county was $27,996, and the median income for a family was $33,093. Males had a median income of $25,758 versus $19,345 for females. The per capita income for the county was $15,424. About 14.10% of families and 18.30% of the population were below the poverty line, including 27.40% of those under age 18 and 11.60% of those age 65 or over.
Politics
| Voter Registration and Party Enrollment as of January 15, 2018[10] | |||||
|---|---|---|---|---|---|
| Party | Number of Voters | Percentage | |||
| Democratic | 8,631 | 40.16% | |||
| Republican | 10,138 | 47.18% | |||
| Others | 2,720 | 12.66% | |||
| Total | 21,489 | 100% | |||
| Year | Republican | Democratic | Third parties |
|---|---|---|---|
| 2016 | 75.3% 11,826 | 21.1% 3,311 | 3.7% 579 |
| 2012 | 70.6% 10,080 | 29.4% 4,196 | |
| 2008 | 66.9% 10,277 | 33.1% 5,085 | |
| 2004 | 64.2% 10,017 | 35.8% 5,591 | |
| 2000 | 57.1% 7,618 | 41.3% 5,514 | 1.7% 221 |
| 1996 | 43.8% 5,230 | 42.7% 5,094 | 13.5% 1,615 |
| 1992 | 39.0% 4,840 | 39.0% 4,842 | 22.1% 2,744 |
| 1988 | 51.4% 5,248 | 47.9% 4,889 | 0.7% 75 |
| 1984 | 63.5% 6,690 | 35.9% 3,789 | 0.6% 63 |
| 1980 | 54.0% 5,302 | 43.2% 4,244 | 2.8% 273 |
| 1976 | 42.1% 3,642 | 56.9% 4,924 | 1.1% 91 |
| 1972 | 70.3% 5,476 | 27.4% 2,135 | 2.3% 178 |
| 1968 | 47.3% 3,168 | 31.8% 2,129 | 20.9% 1,402 |
| 1964 | 42.6% 2,743 | 57.4% 3,702 | |
| 1960 | 61.5% 3,639 | 38.5% 2,282 | |
| 1956 | 53.5% 3,078 | 46.5% 2,679 | |
| 1952 | 55.9% 3,399 | 44.1% 2,686 | |
| 1948 | 42.6% 2,343 | 57.4% 3,157 | |
| 1944 | 51.9% 2,660 | 46.3% 2,373 | 1.8% 93 |
| 1940 | 49.0% 3,305 | 50.7% 3,417 | 0.3% 17 |
| 1936 | 43.5% 2,632 | 56.2% 3,398 | 0.3% 15 |
| 1932 | 28.5% 1,469 | 71.5% 3,684 | |
| 1928 | 59.7% 2,603 | 39.1% 1,706 | 1.2% 51 |
| 1924 | 44.0% 1,563 | 48.6% 1,729 | 7.4% 263 |
| 1920 | 59.2% 2,059 | 36.8% 1,282 | 4.0% 139 |
| 1916 | 36.4% 837 | 53.4% 1,227 | 10.1% 233 |
| 1912 | 38.6% 732 | 51.8% 983 | 9.7% 184 |
Communities
Cities
Towns
Census-designated places
Other unincorporated communities
NRHP sites
The following sites are in Delaware County are listed on the National Register of Historic Places:
- Bassett Grove Ceremonial Grounds, Grove
- Beattie's Prairie, Jay
- Corey House/Hotel, Grove
- Hildebrand Mill, Siloam Springs
- Polson Cemetery, Jay
- Saline Courthouse, Rose
- Splitlog Church, Grove
References
- 1 2 "State & County QuickFacts". United States Census Bureau. Archived from the original on July 9, 2011. Retrieved November 9, 2013.
- ↑ "Find a County". National Association of Counties. Archived from the original on 2011-05-31. Retrieved 2011-06-07.
- 1 2 3 4 5 Stauber, Rose. "Delaware County," Encyclopedia of Oklahoma History and Culture, 2009. Accessed March 25, 2015.
- ↑ "2010 Census Gazetteer Files". United States Census Bureau. August 22, 2012. Retrieved February 19, 2015.
- ↑ "Population and Housing Unit Estimates". Retrieved June 9, 2017.
- ↑ "U.S. Decennial Census". United States Census Bureau. Archived from the original on May 12, 2015. Retrieved February 19, 2015.
- ↑ "Historical Census Browser". University of Virginia Library. Retrieved February 19, 2015.
- ↑ Forstall, Richard L., ed. (March 27, 1995). "Population of Counties by Decennial Census: 1900 to 1990". United States Census Bureau. Retrieved February 19, 2015.
- ↑ "Census 2000 PHC-T-4. Ranking Tables for Counties: 1990 and 2000" (PDF). United States Census Bureau. April 2, 2001. Retrieved February 19, 2015.
- ↑ https://www.ok.gov/elections/documents/20180115%20-%20Registration%20By%20County%20%28vr2420%29.pdf
- ↑ Leip, David. "Dave Leip's Atlas of U.S. Presidential Elections". uselectionatlas.org. Retrieved 2018-03-29.
