Garvin County, Oklahoma
| Garvin County, Oklahoma | |
|---|---|
 | |
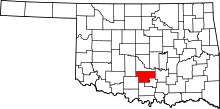 Location in the U.S. state of Oklahoma | |
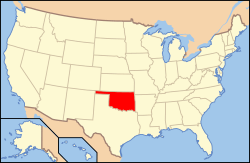 Oklahoma's location in the U.S. | |
| Founded | 1906[1] |
| Named for | Samuel J. Garvin[1] |
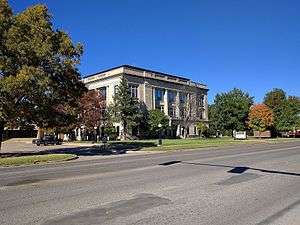
| Seat | Pauls Valley |
| Largest city | Pauls Valley |
| Area | |
| • Total | 814 sq mi (2,108 km2) |
| • Land | 802 sq mi (2,077 km2) |
| • Water | 12 sq mi (31 km2), 1.4% |
| Population (est.) | |
| • (2015) | 27,755 |
| • Density | 34/sq mi (13/km2) |
| Congressional district | 4th |
| Time zone | Central: UTC−6/−5 |
Garvin County is in south-central Oklahoma. As of the 2010 census, the population was 27,576.[2] Its county seat is Pauls Valley.[3] In 1906, delegates to Constitution Convention formed Garvin County from part of the Chickasaw Nation, Indian Territory The county was named for Samuel J. Garvin, a local Chickasaw rancher, merchant and banker. Its economy is largely based on farming, ranching and oil production.[1]
History
An election held June 20, 1908, resulted in county citizens choosing Pauls Valley as the county seat over the towns of Wynnewood and Elmore City.[1]
Oil was discovered in the southwestern part of the county known as Robberson Field in the 1920s. The Golden Trend pool, which ran from the northwest to the southern parts of the county developed later.
Geography
According to the U.S. Census Bureau, the county has a total area of 814 square miles (2,110 km2), of which 802 square miles (2,080 km2) is land and 12 square miles (31 km2) (1.4%) is water.[4] The county lies between the Red Bed plains and the Sandstone Hills physiographic regions. The main waterways are the Washita River, Rush Creek and Wildhorse Creek.[1]
Major highways
Adjacent counties
- McClain County (north)
- Pontotoc County (east)
- Murray County (southeast)
- Carter County (south)
- Stephens County (southwest)
- Grady County (northwest)
Demographics
| Historical population | |||
|---|---|---|---|
| Census | Pop. | %± | |
| 1910 | 26,545 | — | |
| 1920 | 32,445 | 22.2% | |
| 1930 | 31,401 | −3.2% | |
| 1940 | 31,150 | −0.8% | |
| 1950 | 29,500 | −5.3% | |
| 1960 | 28,290 | −4.1% | |
| 1970 | 24,874 | −12.1% | |
| 1980 | 27,856 | 12.0% | |
| 1990 | 26,605 | −4.5% | |
| 2000 | 27,210 | 2.3% | |
| 2010 | 27,576 | 1.3% | |
| Est. 2016 | 27,838 | [5] | 1.0% |
| U.S. Decennial Census[6] 1790-1960[7] 1900-1990[8] 1990-2000[9] 2010-2013[2] | |||

As of the census[10] of 2000, there were 27,210 people, 10,865 households, and 7,605 families residing in the county. The population density was 34 people per square mile (13/km²). There were 12,641 housing units at an average density of 16 per square mile (6/km²). The racial makeup of the county was 84.93% White, 2.55% Black or African American, 7.36% Native American, 0.23% Asian, 0.04% Pacific Islander, 1.54% from other races, and 3.34% from two or more races. 3.40% of the population were Hispanic or Latino of any race.
There were 10,865 households out of which 30.70% had children under the age of 18 living with them, 56.40% were married couples living together, 10.10% had a female householder with no husband present, and 30.00% were non-families. 26.90% of all households were made up of individuals and 14.30% had someone living alone who was 65 years of age or older. The average household size was 2.45 and the average family size was 2.96.
In the county, the population was spread out with 24.80% under the age of 18, 8.10% from 18 to 24, 26.00% from 25 to 44, 23.10% from 45 to 64, and 17.90% who were 65 years of age or older. The median age was 39 years. For every 100 females there were 92.70 males. For every 100 females age 18 and over, there were 88.80 males.
The median income for a household in the county was $28,070, and the median income for a family was $34,774. Males had a median income of $28,033 versus $18,940 for females. The per capita income for the county was $14,856. About 11.40% of families and 15.90% of the population were below the poverty line, including 18.60% of those under age 18 and 14.30% of those age 65 or over.
Politics
| Voter Registration and Party Enrollment as of January 15, 2018[11] | |||||
|---|---|---|---|---|---|
| Party | Number of Voters | Percentage | |||
| Democratic | 6,597 | 44.44% | |||
| Republican | 6,310 | 42.51% | |||
| Others | 1,937 | 13.05% | |||
| Total | 14,844 | 100% | |||
| Year | Republican | Democratic | Third parties |
|---|---|---|---|
| 2016 | 78.3% 8,253 | 17.6% 1,855 | 4.2% 438 |
| 2012 | 73.0% 6,925 | 27.0% 2,559 | |
| 2008 | 71.8% 7,710 | 28.2% 3,028 | |
| 2004 | 67.2% 7,610 | 32.8% 3,707 | |
| 2000 | 56.2% 5,536 | 42.6% 4,189 | 1.2% 118 |
| 1996 | 38.3% 3,745 | 47.5% 4,639 | 14.2% 1,383 |
| 1992 | 33.6% 3,983 | 40.6% 4,811 | 25.9% 3,069 |
| 1988 | 47.9% 5,109 | 51.0% 5,438 | 1.0% 109 |
| 1984 | 63.5% 7,505 | 35.7% 4,215 | 0.8% 91 |
| 1980 | 50.8% 5,520 | 46.3% 5,033 | 2.8% 307 |
| 1976 | 36.2% 3,905 | 63.0% 6,797 | 0.8% 83 |
| 1972 | 70.7% 7,245 | 26.2% 2,685 | 3.1% 315 |
| 1968 | 36.8% 3,786 | 37.3% 3,845 | 25.9% 2,670 |
| 1964 | 33.1% 3,470 | 66.9% 7,013 | |
| 1960 | 51.7% 5,125 | 48.3% 4,795 | |
| 1956 | 37.4% 3,850 | 62.6% 6,451 | |
| 1952 | 39.1% 4,402 | 60.9% 6,844 | |
| 1948 | 19.9% 1,681 | 80.1% 6,779 | |
| 1944 | 28.1% 2,086 | 71.8% 5,328 | 0.1% 7 |
| 1940 | 29.6% 2,958 | 70.0% 7,001 | 0.4% 40 |
| 1936 | 21.2% 1,700 | 78.1% 6,276 | 0.7% 58 |
| 1932 | 11.7% 1,034 | 88.3% 7,834 | |
| 1928 | 47.4% 3,321 | 51.3% 3,589 | 1.3% 91 |
| 1924 | 26.9% 1,863 | 68.6% 4,758 | 4.5% 312 |
| 1920 | 40.1% 2,922 | 56.2% 4,093 | 3.8% 274 |
| 1916 | 17.8% 804 | 59.6% 2,697 | 22.6% 1,023 |
| 1912 | 18.9% 740 | 53.9% 2,114 | 27.2% 1,068 |
Economy
While oil and gas production are important to the county economy, agriculture has been the major industry for employment since statehood. In 1907 crops of alfalfa, broomcorn, cotton, onions, potatoes, and hay produced in the county were valued at $2.5 million. By the 1930s over 1,000 acres (400 ha) had been planted with paper shelled pecan trees. By 1961 the Lindsay area harvested more broomcorn than any other region in the world, and the county slogan became "We sweep the world."[1]
Communities
See also
References
- 1 2 3 4 5 6 Lough, D. Keith. "Oklahoma Encyclopedia of History and Culture - Garvin County". Retrieved 2015-04-04.
- 1 2 "State & County QuickFacts". United States Census Bureau. Archived from the original on July 10, 2011. Retrieved November 9, 2013.
- ↑ "Find a County". National Association of Counties. Archived from the original on 2011-05-31. Retrieved 2011-06-07.
- ↑ "2010 Census Gazetteer Files". United States Census Bureau. August 22, 2012. Retrieved February 21, 2015.
- ↑ "Population and Housing Unit Estimates". Retrieved June 9, 2017.
- ↑ "U.S. Decennial Census". United States Census Bureau. Archived from the original on May 12, 2015. Retrieved February 21, 2015.
- ↑ "Historical Census Browser". University of Virginia Library. Retrieved February 21, 2015.
- ↑ Forstall, Richard L., ed. (March 27, 1995). "Population of Counties by Decennial Census: 1900 to 1990". United States Census Bureau. Retrieved February 21, 2015.
- ↑ "Census 2000 PHC-T-4. Ranking Tables for Counties: 1990 and 2000" (PDF). United States Census Bureau. April 2, 2001. Retrieved February 21, 2015.
- ↑ "American FactFinder". United States Census Bureau. Archived from the original on 2013-09-11. Retrieved 2008-01-31.
- ↑ https://www.ok.gov/elections/documents/20180115%20-%20Registration%20By%20County%20%28vr2420%29.pdf
- ↑ Leip, David. "Dave Leip's Atlas of U.S. Presidential Elections". uselectionatlas.org. Retrieved 2018-03-29.
External links
- Encyclopedia of Oklahoma History and Culture - Garvin County
- Oklahoma Digital Maps: Digital Collections of Oklahoma and Indian Territory
- Garvin County Sheriff's Office
Places adjacent to Garvin County, Oklahoma | |
|---|---|
Municipalities and communities of Garvin County, Oklahoma, United States | ||
|---|---|---|
| Cities | | |
| Towns | ||
| Unincorporated communities | ||
| Ghost town | ||
| Footnotes | ‡This populated place also has portions in an adjacent county or counties | |