Cimarron County, Oklahoma
| Cimarron County, Oklahoma | |
|---|---|
 Cimarron County Courthouse in Boise City | |
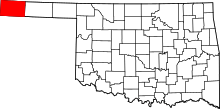 Location in the U.S. state of Oklahoma | |
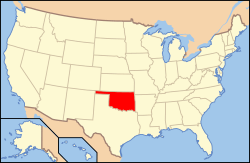 Oklahoma's location in the U.S. | |
| Founded | 1907 |
| Seat | Boise City |
| Largest city | Boise City |
| Area | |
| • Total | 1,841 sq mi (4,768 km2) |
| • Land | 1,835 sq mi (4,753 km2) |
| • Water | 6.1 sq mi (16 km2), 0.3% |
| Population (est.) | |
| • (2013) | 2,335 |
| • Density | 1.3/sq mi (0.5/km2) |
| Time zones | Central: UTC−6/−5 |
|
Mountain: UTC−7/−6 Kenton (unofficially) | |
Cimarron County is the westernmost county in the U.S. state of Oklahoma. As of the 2010 census, the population was 2,475,[1] making it the least-populous county in Oklahoma. Its county seat is Boise City.[2]
Located in the Oklahoma Panhandle, Cimarron County contains the only community in the state (Kenton) that observes the Mountain Time Zone. Black Rock Mesa, the highest point in the state, is in the northwest corner of the county. Throughout most of its history it has had both the smallest population and the lowest population density of any county in Oklahoma.
History
Cimarron County was created at statehood in 1907. Before the Oklahoma Organic Act was passed in 1890, the area had belonged to what was known as "No Man's Land," also referred to as the "Public Land Strip." This was a relatively lawless area, with no organized government, and several outlaws sought refuge within its borders. In 1890, the strip became known as Beaver County, Oklahoma Territory. Informally, it was known as the "Oklahoma Panhandle." There were only two communities in the strip. One, Carrizo, had 83 residents in 1890, while the other, Mineral City, had 93 residents. Otherwise, the land was used primarily by sheepherders from New Mexico.[3]
Seven communities vied to become county seat after statehood: Boise City, Cimarron, Doby, Hurley and Willowbar. A county election in 1908 selected Boise City.[3]
Railroads came late to this part of Oklahoma. The Elkhart and Santa Fe Railway built a line from Elkhart, Kansas through Cimarron County in 1925. It completed the link into New Mexico in 1932. Service ended in 1942. The same company built a line from Colorado to Boise City in 1931 and extended it into Texas in 1937. This line still operates and in 2000 was part of the BNSF system.[3]
Geography
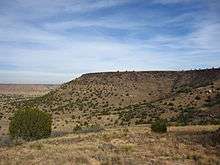
According to the U.S. Census Bureau, the county has a total area of 1,841 square miles (4,770 km2), of which 1,835 square miles (4,750 km2) is land and 6.1 square miles (16 km2) (0.3%) is water.[4] It is the fourth-largest county in Oklahoma by area. It also has Oklahoma's highest point at 4,973 feet (1,516 m) (AMSL) on the Black Mesa.
The northern part of the county is drained by the Cimarron River, which flows eastward, then turns north into Kansas, The southern part is drained by the North Canadian River (also called the Beaver River). The man-made Lake Carl Etling lies inside Black Mesa park.[3]
A location 300 yards (270 m) east of Rt. 287/385 and 1.75 miles (2.82 km) south of the Cimarron River is the only place in the US less than 27 miles (43 km) from five different states: 26.99 miles (43.44 km) from Kansas, New Mexico, and Texas and 7 miles (11 km) from Colorado.[5]
The Boise City Airport is located approximately four miles north of Boise City.
Major highways
Adjacent counties
Cimarron County is the only county in the United States that borders four states: Colorado, Kansas, New Mexico, and Texas.[3] As a result, Cimarron County is the only county in the United States to border at least five counties from five different states (one from each of the four aforementioned states, plus one in Oklahoma and a second county in Texas).
- Baca County, Colorado (north/Mountain Time border)
- Morton County, Kansas (northeast)
- Texas County (east)
- Dallam County, Texas (south)
- Sherman County, Texas (southeast)
- Union County, New Mexico (west/Mountain Time border)
National protected area
Demographics
| Historical population | |||
|---|---|---|---|
| Census | Pop. | %± | |
| 1910 | 4,553 | — | |
| 1920 | 3,436 | −24.5% | |
| 1930 | 5,408 | 57.4% | |
| 1940 | 3,054 | −43.5% | |
| 1950 | 4,589 | 50.3% | |
| 1960 | 4,496 | −2.0% | |
| 1970 | 4,145 | −7.8% | |
| 1980 | 3,648 | −12.0% | |
| 1990 | 3,301 | −9.5% | |
| 2000 | 3,148 | −4.6% | |
| 2010 | 2,475 | −21.4% | |
| Est. 2016 | 2,162 | [6] | −12.6% |
| U.S. Decennial Census[7] 1790-1960[8] 1900-1990[9] 1990-2000[10] 2010-2013[1] | |||

As of the 2010 census, there were 2,475 people, 1,047 households, and 705 families residing in the county. The population density was 2 people per square mile (1/km²). There were 1,587 housing units at an average density of 1 per square mile (0/km²). The racial makeup of the county was 84.7% White, 0.2% Black or African American, 0.8% Native American, 0.3% Asian, 12.1% from other races, and 1.8% from two or more races. 20.8% of the population were Hispanic or Latino of any race (16.4% Mexican, 1.4% Spanish, 0.2% Salvadoran).[12][13]
There were 1,257 households out of which 31.30% had children under the age of 18 living with them, 60.40% were married couples living together, 6.00% had a female householder with no husband present, and 30.90% were non-families. 29.30% of all households were made up of individuals and 15.50% had someone living alone who was 65 years of age or older. The average household size was 2.47 and the average family size was 3.07.
In the county, the population was spread out with 27.60% under the age of 18, 6.40% from 18 to 24, 23.40% from 25 to 44, 24.00% from 45 to 64, and 18.60% who were 65 years of age or older. The median age was 39 years. For every 100 females there were 97.40 males. For every 100 females age 18 and over, there were 95.30 males.
The median income for a household in the county was $30,625, and the median income for a family was $36,250. Males had a median income of $24,327 versus $18,110 for females. The per capita income for the county was $15,744. About 13.90% of families and 17.60% of the population were below the poverty line, including 22.20% of those under age 18 and 10.10% of those age 65 or over.
Politics
| Year | Republican | Democratic | Third parties |
|---|---|---|---|
| 2016 | 89.3% 963 | 6.6% 71 | 4.2% 45 |
| 2012 | 90.4% 1,082 | 9.6% 115 | |
| 2008 | 88.0% 1,119 | 12.0% 152 | |
| 2004 | 87.1% 1,242 | 12.9% 184 | |
| 2000 | 82.9% 1,230 | 15.3% 227 | 1.8% 27 |
| 1996 | 67.8% 986 | 24.8% 361 | 7.4% 108 |
| 1992 | 59.4% 965 | 24.3% 395 | 16.3% 264 |
| 1988 | 70.0% 1,153 | 28.5% 470 | 1.5% 24 |
| 1984 | 79.2% 1,420 | 20.0% 359 | 0.8% 15 |
| 1980 | 77.1% 1,404 | 20.5% 373 | 2.4% 44 |
| 1976 | 46.4% 872 | 51.2% 962 | 2.4% 45 |
| 1972 | 71.6% 1,350 | 17.1% 323 | 11.3% 212 |
| 1968 | 53.8% 1,122 | 20.9% 436 | 25.3% 527 |
| 1964 | 58.3% 1,225 | 41.8% 878 | |
| 1960 | 65.4% 1,316 | 34.6% 696 | |
| 1956 | 56.5% 1,053 | 43.5% 812 | |
| 1952 | 67.1% 1,438 | 32.9% 705 | |
| 1948 | 42.1% 650 | 57.9% 894 | |
| 1944 | 52.1% 822 | 47.3% 746 | 0.7% 11 |
| 1940 | 45.4% 841 | 53.4% 989 | 1.2% 23 |
| 1936 | 29.1% 555 | 70.3% 1,342 | 0.7% 13 |
| 1932 | 23.2% 571 | 76.9% 1,895 | |
| 1928 | 66.0% 1,139 | 32.8% 566 | 1.2% 20 |
| 1924 | 41.2% 586 | 47.3% 672 | 11.5% 164 |
| 1920 | 53.5% 630 | 39.5% 465 | 7.1% 83 |
| 1916 | 30.9% 238 | 50.2% 387 | 18.9% 146 |
| 1912 | 37.0% 263 | 48.2% 342 | 14.8% 105 |
| Voter Registration and Party Enrollment as of January 15, 2018[15] | |||||
|---|---|---|---|---|---|
| Party | Number of Voters | Percentage | |||
| Democratic | 364 | 23.44% | |||
| Republican | 1,035 | 66.65% | |||
| Others | 154 | 9.92% | |||
| Total | 1,553 | 100% | |||
Economy
The county economy has been largely based on cattle ranching and agriculture throughout its history. Wheat and grain sorghum are the most important crops. The Dust Bowl devastated the county during the 1930s, and the deluges of 1942-1945 destroyed what was left; the economy had to be completely rebuilt. Oil and natural gas production became important in the 1960s, and a gas plant near Keyes began producing helium in 1959. In 2000, Cimarron County had the ninth largest per capita income of all Oklahoma counties.[3] Cimarron is one of 25 dry counties in the state.
Communities
City
- Boise City (county seat)
Town
Census-designated places
Other unincorporated places
See also
References
- 1 2 "State & County QuickFacts". United States Census Bureau. Retrieved November 8, 2013.
- ↑ "Find a County". National Association of Counties. Archived from the original on May 31, 2011. Retrieved June 7, 2011.
- 1 2 3 4 5 6 Young, Norma Gene. "Cimarron County," Encyclopedia of Oklahoma History and Culture, 2009. Accessed March 28, 2015.
- ↑ "2010 Census Gazetteer Files". United States Census Bureau. August 22, 2012. Retrieved February 18, 2015.
- ↑ From United States Geological Survey sources, an area one mile southwest of Goshen, MA is 27.3 miles (43.9 km) from five different states, second to this Cimarron County location.
- ↑ "Population and Housing Unit Estimates". Retrieved June 9, 2017.
- ↑ "U.S. Decennial Census". United States Census Bureau. Archived from the original on May 12, 2015. Retrieved February 18, 2015.
- ↑ "Historical Census Browser". University of Virginia Library. Retrieved February 18, 2015.
- ↑ Forstall, Richard L., ed. (March 27, 1995). "Population of Counties by Decennial Census: 1900 to 1990". United States Census Bureau. Retrieved February 18, 2015.
- ↑ "Census 2000 PHC-T-4. Ranking Tables for Counties: 1990 and 2000" (PDF). United States Census Bureau. April 2, 2001. Retrieved February 18, 2015.
- ↑ Oklahoma's True Grit Dust Bowl Family, 77 Years Later; 405 Magazine.
- ↑ "Archived copy". Archived from the original on March 5, 2014. Retrieved May 15, 2016.
- ↑ "Archived copy". Archived from the original on December 18, 2014. Retrieved May 7, 2016.
- ↑ Leip, David. "Dave Leip's Atlas of U.S. Presidential Elections". uselectionatlas.org. Retrieved March 28, 2018.
- ↑ https://www.ok.gov/elections/documents/20180115%20-%20Registration%20By%20County%20%28vr2420%29.pdf
Further reading
- Egan, Timothy (2006). The Worst Hard Time: The Untold Story of Those Who Survived the Great American Dust Bowl. Boston: Mariner Books. ISBN 0-618-34697-X. OCLC 58788898. , includes much about the history of Cimarron County in the 20th century.
External links
| Wikimedia Commons has media related to Cimarron County, Oklahoma. |
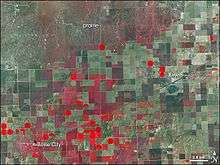
- NASA Earth Obseratory article about Cimarron County
- Encyclopedia of Oklahoma History and Culture - Cimarron County
- Oklahoma Digital Maps: Digital Collections of Oklahoma and Indian Territory
- Cimarron County Sheriff's Office
Places adjacent to Cimarron County, Oklahoma | ||||||||||
|---|---|---|---|---|---|---|---|---|---|---|
| ||||||||||
Municipalities and communities of Cimarron County, Oklahoma, United States | ||
|---|---|---|
| City | | |
| Town | ||
| CDPs | ||
| Other unincorporated communities | ||