Pontotoc County, Oklahoma
| Pontotoc County, Oklahoma | |
|---|---|
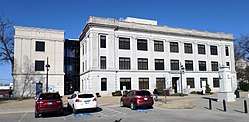 Pontotoc County Courthouse in Ada | |
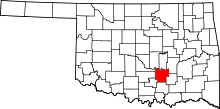 Location in the U.S. state of Oklahoma | |
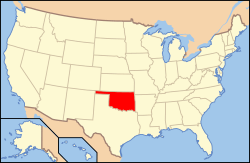 Oklahoma's location in the U.S. | |
| Founded | 1907 |
| Seat | Ada |
| Largest city | Ada |
| Area | |
| • Total | 725 sq mi (1,878 km2) |
| • Land | 720 sq mi (1,865 km2) |
| • Water | 4.8 sq mi (12 km2), 0.7% |
| Population (est.) | |
| • (2015) | 38,194 |
| • Density | 52/sq mi (20/km2) |
| Congressional district | 4th |
Pontotoc County is in the south central part of Oklahoma. As of the 2010 census, the population was 37,492.[1] Its county seat is Ada.[2] The county was created at statehood from part of the Chickasaw Nation in Indian Territory. It was named for a historic Chickasaw tribal area in Mississippi. According to the Encyclopedia of Oklahoma History and Culture, Pontotoc is usually translated "cattail prairie" or "land of hanging grapes." [3]
Pontotoc County comprises the Ada, OK Micropolitan Statistical Area.
The Chickasaw Nation's headquarters are in Ada.
History
The present Pontotoc County was part of the land that the U. S. government granted in 1830 to the Choctaw tribe via the Treaty of Dancing Rabbit Creek. In 1837, the Chickasaw tribe was granted land within the Choctaw domain. In 1857, the Chickasaw Nation formed its own government on this land. However, few Chickasaw settled there until after the Civil War, mainly because of attacks by various Plains Indian tribes.[3]
The first settlers were located in the vicinity of Boggy Depot during the 1840s. Camp Arbuckle was established to protect migrants traveling on the California Road. After the Civil War, settlements began spreading through the area. Some of the new settlers were illegal white intruders and outlaws. The first post office was established at Stonewall in 1878. The town of Ada was founded in 1890. After three railroads built lines through Ada, it became the dominant community of the area. Ada was named county seat when Pontotoc County was created.[3]
Geography
According to the U.S. Census Bureau, the county has a total area of 725 square miles (1,880 km2), of which 720 square miles (1,900 km2) is land and 4.8 square miles (12 km2) (0.7%) is water.[4] The Canadian River forms the northern boundary.[3]
Adjacent counties
- Seminole County (north)
- Hughes County (northeast)
- Coal County (southeast)
- Johnston County (south)
- Murray County (southwest)
- Garvin County (west)
- McClain County (northwest)
- Pottawatomie County (northwest)
Demographics
| Historical population | |||
|---|---|---|---|
| Census | Pop. | %± | |
| 1910 | 24,331 | — | |
| 1920 | 30,949 | 27.2% | |
| 1930 | 32,469 | 4.9% | |
| 1940 | 39,792 | 22.6% | |
| 1950 | 30,875 | −22.4% | |
| 1960 | 28,089 | −9.0% | |
| 1970 | 27,867 | −0.8% | |
| 1980 | 32,598 | 17.0% | |
| 1990 | 34,119 | 4.7% | |
| 2000 | 35,143 | 3.0% | |
| 2010 | 37,492 | 6.7% | |
| Est. 2016 | 38,330 | [5] | 2.2% |
| U.S. Decennial Census[6] 1790-1960[7] 1900-1990[8] 1990-2000[9] 2010-2013[1] | |||
As of the 2010 United States Census, there were 37,492 people residing in the county. 71.2% were White, 17.4% Native American, 2.4% Black or African American, 0.7% Asian, 1.1% of some other race and 7.2% of two or more races. 4.1% were Hispanic or Latino (of any race).
As of the census[10] of 2000, there were 35,143 people, 13,978 households, and 9,421 families residing in the county. The population density was 19/km² (49/mi²). There were 15,575 housing units at an average density of 8/km² (22/mi²). The racial makeup of the county was 75.80% White, 2.06% Black or African American, 15.51% Native American, 0.46% Asian, 0.02% Pacific Islander, 0.79% from other races, and 5.36% from two or more races. 2.30% of the population were Hispanic or Latino of any race.
There were 13,978 households out of which 30.80% had children under the age of 18 living with them, 52.90% were married couples living together, 10.80% had a female householder with no husband present, and 32.60% were non-families. 28.10% of all households were made up of individuals and 12.30% had someone living alone who was 65 years of age or older. The average household size was 2.44 and the average family size was 2.98.
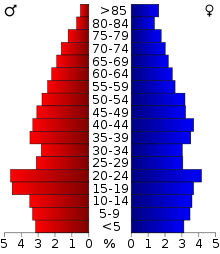
In the county, the population was spread out with 24.70% under the age of 18, 12.50% from 18 to 24, 26.00% from 25 to 44, 21.90% from 45 to 64, and 15.00% who were 65 years of age or older. The median age was 36 years. For every 100 females there were 93.30 males. For every 100 females age 18 and over, there were 90.60 males.
The median income for a household in the county was $26,955, and the median income for a family was $35,400. Males had a median income of $26,785 versus $18,939 for females. The per capita income for the county was $14,664. About 11.80% of families and 16.50% of the population were below the poverty line, including 20.10% of those under age 18 and 11.70% of those age 65 or over.
Politics
| Voter Registration and Party Enrollment as of January 15, 2018[11] | |||||
|---|---|---|---|---|---|
| Party | Number of Voters | Percentage | |||
| Democratic | 9,931 | 47.86% | |||
| Republican | 7,905 | 38.10% | |||
| Others | 2,914 | 14.04% | |||
| Total | 20,750 | 100% | |||
| Year | Republican | Democratic | Third Parties |
|---|---|---|---|
| 2016 | 70.3% 10,431 | 24.5% 3,637 | 5.1% 763 |
| 2012 | 69.4% 8,945 | 30.6% 3,947 | |
| 2008 | 68.4% 9,750 | 31.6% 4,512 | |
| 2004 | 65.1% 9,647 | 34.9% 5,165 | |
| 2000 | 56.9% 7,299 | 42.0% 5,387 | 1.2% 150 |
| 1996 | 39.4% 5,366 | 47.5% 6,470 | 13.1% 1,777 |
| 1992 | 33.5% 5,206 | 40.9% 6,350 | 25.6% 3,965 |
| 1988 | 49.9% 6,609 | 49.0% 6,484 | 1.1% 146 |
| 1984 | 59.7% 8,301 | 39.7% 5,526 | 0.6% 80 |
| 1980 | 49.3% 6,232 | 47.0% 5,942 | 3.6% 457 |
| 1976 | 39.2% 4,895 | 59.8% 7,466 | 1.0% 125 |
| 1972 | 72.0% 8,762 | 26.0% 3,160 | 2.0% 240 |
| 1968 | 38.3% 4,161 | 39.5% 4,291 | 22.3% 2,425 |
| 1964 | 35.9% 4,166 | 64.1% 7,449 | |
| 1960 | 55.8% 5,863 | 44.3% 4,654 | |
| 1956 | 44.7% 4,814 | 55.3% 5,950 | |
| 1952 | 42.8% 5,389 | 57.2% 7,208 | |
| 1948 | 22.8% 2,289 | 77.2% 7,750 | |
| 1944 | 31.1% 2,960 | 68.7% 6,552 | 0.2% 21 |
| 1940 | 27.0% 3,449 | 72.8% 9,310 | 0.3% 35 |
| 1936 | 19.9% 2,015 | 79.7% 8,079 | 0.4% 42 |
| 1932 | 14.3% 1,207 | 85.7% 7,227 | |
| 1928 | 50.9% 3,356 | 48.6% 3,203 | 0.6% 38 |
| 1924 | 28.1% 1,859 | 64.5% 4,268 | 7.5% 493 |
| 1920 | 37.2% 2,370 | 59.6% 3,800 | 3.2% 206 |
| 1916 | 21.3% 913 | 56.4% 2,418 | 22.3% 957 |
| 1912 | 18.8% 642 | 53.8% 1,842 | 27.4% 937 |
Economy
Cattle ranching was one of the most important economic activities in this area up through the territorial period. Agriculture rose to prominence in the early 20th century, with cotton being the most important crop. Cattle raising reemerged as the major industry, and the county is sometimes called "Hereford Heaven." [3]
Other important economic activities include limestone quarrying, cement production, light manufacturing, services and government. The city of Ada is the headquarters of the Chickasaw Nation, and the base of the Carl Albert Indian Health System.[3]
Communities
City
- Ada (county seat)
Towns
Census-designated place
Other unincorporated places
NRHP sites
The following sites in Pontotoc County are listed on the National Register of Historic Places:
- Ada Public Library, Ada
- Bebee Field Round House, Ada
- East Central State Normal School, Ada
- Mijo Camp Industrial District, Ada
- Pontotoc County Courthouse, Ada
- Roff Armory, Roff
- Sugg Clinic, Ada
- Wintersmith Park Historic District, Ada
See also
References
- 1 2 "State & County QuickFacts". United States Census Bureau. Retrieved November 12, 2013.
- ↑ "Find a County". National Association of Counties. Retrieved 2011-06-07.
- 1 2 3 4 5 6 Turner, Alvin O. "Pontotoc County," Encyclopedia of Oklahoma History and Culture, Oklahoma Historical Society, 2009. Accessed April 4, 2015.
- ↑ "2010 Census Gazetteer Files". United States Census Bureau. August 22, 2012. Retrieved February 22, 2015.
- ↑ "Population and Housing Unit Estimates". Retrieved June 9, 2017.
- ↑ "U.S. Decennial Census". United States Census Bureau. Retrieved February 22, 2015.
- ↑ "Historical Census Browser". University of Virginia Library. Retrieved February 22, 2015.
- ↑ Forstall, Richard L., ed. (March 27, 1995). "Population of Counties by Decennial Census: 1900 to 1990". United States Census Bureau. Retrieved February 22, 2015.
- ↑ "Census 2000 PHC-T-4. Ranking Tables for Counties: 1990 and 2000" (PDF). United States Census Bureau. April 2, 2001. Retrieved February 22, 2015.
- ↑ "American FactFinder". United States Census Bureau. Retrieved 2008-01-31.
- ↑ https://www.ok.gov/elections/documents/20180115%20-%20Registration%20By%20County%20%28vr2420%29.pdf
- ↑ Leip, David. "Dave Leip's Atlas of U.S. Presidential Elections". uselectionatlas.org. Retrieved 2018-03-29.
Places adjacent to Pontotoc County, Oklahoma | |
|---|---|
Municipalities and communities of Pontotoc County, Oklahoma, United States | ||
|---|---|---|
| City | | |
| Towns | ||
| CDP | ||
| Other unincorporated communities |
| |
| Footnotes | ‡This populated place also has portions in an adjacent county or counties | |